Biomedical Engineering Reference
In-Depth Information
(1)
(1)
(2)
(2)
(3)
(3)
(4)
(4)
(5)
(5)
(6)
(6)
2
π
2
π
0
0
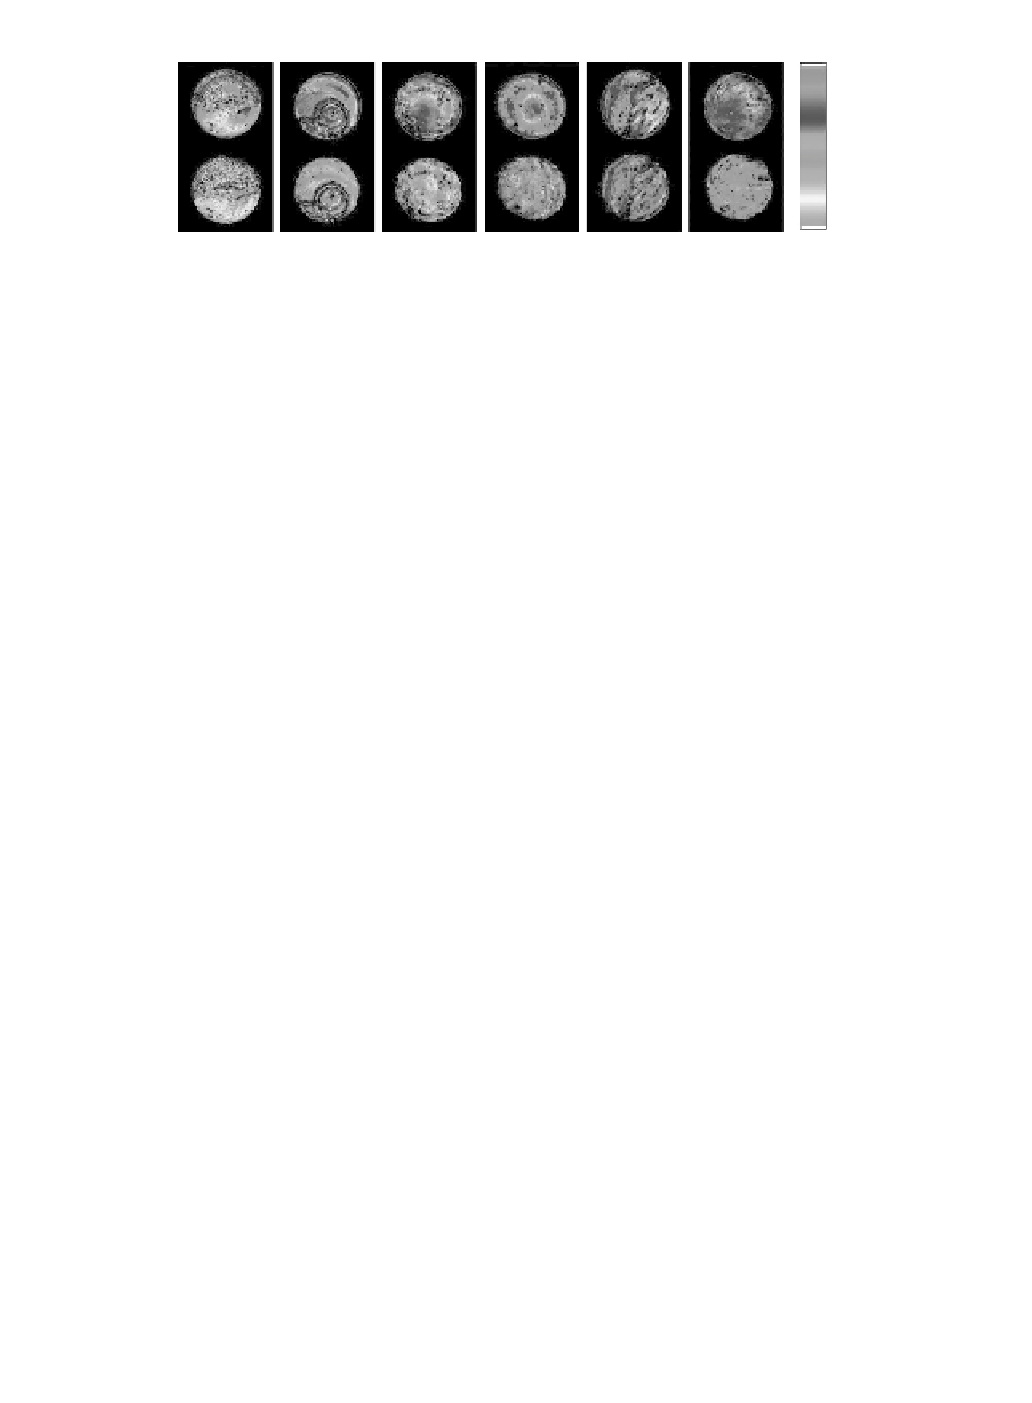
Figure 4.17 (See color insert.)
Speciic interferogram examples from a particular position within the 16 × 16
grid that was recorded for each specimen. he color encodes the phase, and the brightness corresponds to the ampli-
tude. he numbers (1)-(6) are the specimen numbers listed in
Table 4.2
.
he upper part shows the measured initial
wavefront; the lower part, a simulated correction of the Zernike modes up to
i
= 22.
(data not shown), the aberration appeared to be dominated by high spatial frequency variations that
could not be removed by a small number of modes. In image (2), some of the structure of the mouse
oocyte is visible in the pupil. here is a sudden change of phase accompanied by amplitude efects at
the cell boundaries. Again partial correction was achieved, which can be considered optimal within
the modes included. he mouse liver wavefront shown in image (3) exhibits strong but rather smooth
disturbance and good correction was achieved. In image (4), the sample of striated muscle is shown.
A rather smooth disturbance, which can be well corrected with a low-order Zernike modal approach, is
present. In this case, a large amount of spherical aberration, probably arising from the refractive index
mismatch, was removed in the calibration step. Image (5) shows a heavily aberrated wavefront from the
C. elegans
specimen. he smooth muscle tissue wavefronts are depicted in image (6); the phase distur-
bance contained mainly low-order Zernike terms and the almost uniform color (lower part) indicates
very good phase correction.
4.13 Wavefront Quality Characterization
he quality of an optical system is oten characterized by the Strehl ratio (Born and Wolf 1983), as dis-
cussed in Chapter 1, which is deined as the ratio of the maxima of the focal intensity distributions for
the aberrated and the unaberrated wavefronts. We deine the Strehl ratio as follows:
1
2
π
∫
∫
|
A r
( , )exp(
θ
j
ψ θ
( , ))
r
r r
d d
θ
|
2
S
=
0
0
(4.11)
2
1
2
π
∫
∫
A
( , )
r
θ
r r
d d
θ
0
0
his deinition is slightly diferent from that by Born and Wolf (1983) in that it takes the amplitude
variations into account. For moderate aberrations, and especially if the wavefront contains only small
amounts of the Zernike modes tip, tilt, or defocus, Equation 4.11 is equivalent to the ratio of the maxi-
mum focal intensity to the difraction-limited maximum intensity.
Also, for small aberrations and no amplitude variations, the Strehl ratio may be estimated from the
variance of the wavefront (Born and Wolf 1983) and inally the Zernike mode coeicients
M
i
:
∞
∑
S
≈ −
1
Var(
ψ θ
( , ))
r
= −
1
M
i
2
(4.12)
i
=
5