Biomedical Engineering Reference
In-Depth Information
Specimen: Mouse oocyte cell
0.5
0.4
0.3
0.2
0.1
0
Mean
Standard deviation
5
6
7
8
9
10
11
12
13
14
15
16
17
18
19
20
21
22
‒
0.1
‒
0.2
‒
0.3
‒
0.4
‒
0.5
Zernike mode number
Specimen: Mouse blastocyst
0.25
0.2
0.15
0.1
0.05
0
5
6
7
8
9
10
11
12
13
14
15
16
17
18
19
20
21
22
‒
0.05
‒
0.1
‒
0.15
‒
0.2
‒
0.25
Mean
Standard deviation
Zernike mode number
Specimen: Nematode C.Elegans
0.25
0.2
0.15
Mean
Standard deviation
0.1
0.05
0
5
6
7
8
9
10
11
12
13
14
15
16
17
18
19
20
21
22
‒
0.05
Zernike mode number
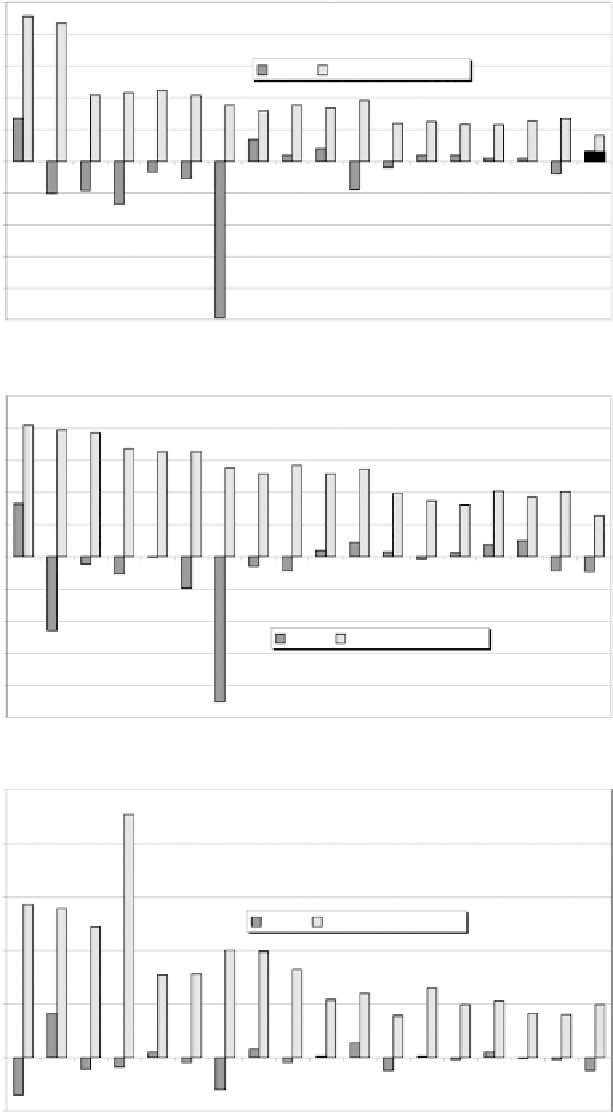
Figure 4.13
Mean and standard deviation across the ield of view for the extracted Zernike coeicients for 256
measured wavefronts. he standard deviation of the Zernike modes is declining with rising order. Note that the graphs
for the mouse oocyte sample (top) and the mouse blastocyst (middle) contain the static- and the ield-dependent
contributions to the aberration, while the chart for the
C. elegans
(bottom) includes the ield-dependent fraction only.