Biomedical Engineering Reference
In-Depth Information
Again the normalized optical coordinates
ν
and
u
as deined in Equations 3.8 and 3.9 are used.
From Equation 4.6, we see that the aberrations have a direct efect on the amplitude PSF of the imag-
ing lens. In Section 3.4, it is explained how the PSF relates to the inal image of the CFM.
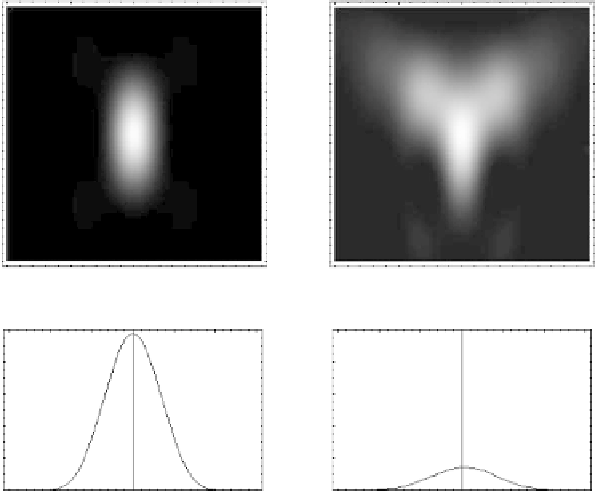
To illustrate the efect of aberrations on the imaging quality of the CFM, we calculated the image
of an ininitely small luorescent object using Equations 4.6 and 3.12 under the assumption that the
luorescence wavelength is equal to the excitation wavelength (i.e., β = 1). Figure 4.3 shows the result
for the unaberrated wavefront (let column) and the aberrated wavefront (right column) that contains
1 Zernike unit of astigmatism (i.e.,
M
5
= 1, other coeicients are zero in Equation 4.3; see
Section 4.3
).
As we see from the experimental data from typical biological specimen, 1 Zernike unit is a rather large
amount for an individual aberration mode. For
M
5
, values as high as 0.5 were observed. However, the
combined value across diferent Zernike modes can easily exceed 1 Zernike unit. In the example of
Figure 4.3, the shape of the PSF has completely changed; it has very large side lobes due to the aberra-
tion. Please note that the images of the intensity PSF (upper two images in Fig. 4.3) are both normalized,
while the plots on the bottom of Figure 4.3 show a cross section through the PSF in the axial direction at
the same scale. A drop in intensity of about 80% is visible. Each type of aberration (i.e., Zernike mode)
has a distinct efect on the PSF and hence on the imaging performance.
It can be concluded that aberrations degrade both resolution and intensity of the confocal image. he
degraded intensity may cause problems in practical setups since the excitation intensity should be kept
as low as possible to avoid photobleaching of the dye or sample degradation. Especially the axial exten-
sion of the PSF is sensitive to aberrations. Hence, aberrations mainly reduce the axial resolution, which
is, even in a perfect system, worse than the lateral resolution.
Unaberrated
Aberrated
15
15
10
10
5
5
u
0
u
0
-
5
-
5
-
10
-
10
-
15
-
15
-
10
-
5
0
v
5
10
-
10
-
5
0
5
10
v
100
100
PSF (
u
,0,0)
PSF (
u
,0,0)
80
60
80
60
40
40
20
20
-
15
-
10
-
5
0
5
10
15
-
15
-
10
-
5
0
5
10
15
u
u
Figure 4.3
Efect of aberrations on the imaging performance. he unaberrated intensity PSF is shown on the
let and the corresponding aberrated PSF on the right. Shape and intensity of the PSF changed due to the aberra-
tions. Note the diferent normalization of the two-dimensional plots.