Biomedical Engineering Reference
In-Depth Information
image. plane,.
w
. is. the. wavefront. measurement,. and.λ. is. the. wavelength. at. which. the. measurement.
was.taken.
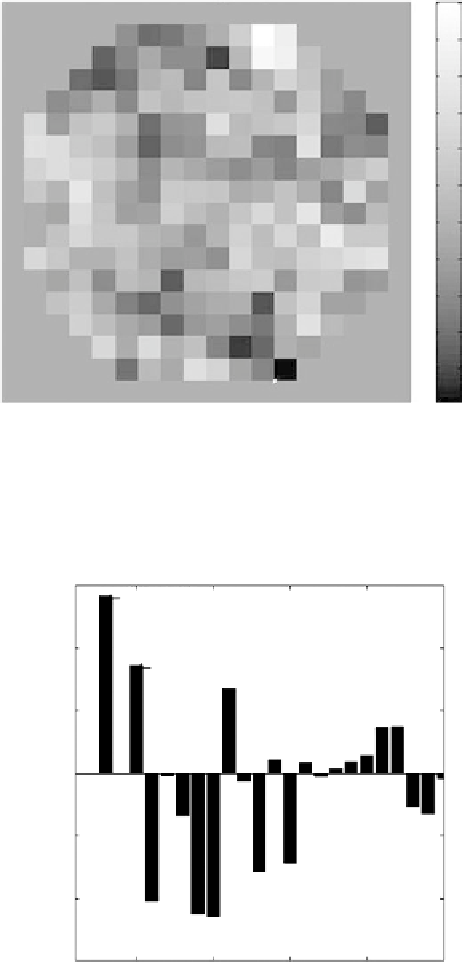
A.measurement.of.the.wavefront.from.a.1.μm.crimson.luorescent.microsphere.embedded.45.μm.below.the.
surface.of.a.
Drosophila
.embryo.using.a.dry.20×.(0.40.NA).objective.lens.is.shown.in.Figure 17.8..he.distance.
between.points.is.equal.to.the.subaperture.diameter,.
d
LA.
,.for.a.total.of.216.apertures.on.the.circular.pupil..As.
can.be.seen.from.Figure.17.8,.the.PV.wavefront.error.is.~0.56.μm.and.the.RMS.wavefront.error.for.this.mea-
surement.is.0.09.μm..Figure.17.9.shows.the.Zernike.coeicients.for.the.wavefront.shown.in.Figure 17.8..As.can.
Wavefront with no Tip, Tilt, and Focus
0.3
18
0.25
16
0.2
0.15
14
0.1
12
0.05
10
0
8
-
0.05
6
-
0.1
-
0.15
4
-
0.2
2
2
4
6
8
10
X
(Apertures)
12
14
16
18
FIGuRE 17.8
A.wavefront.measurement.from.a.1.μm.luorescent.microsphere.embedded.45.μm.below.the.surface.
of.a.
Drosophila
.embryo.using.a.20×.(0.40.NA).objective.lens.with.tip,.tilt,.and.focus.subtracted..he.
x
.and.
y
.axes.are.
scaled.to.the.subaperture.diameter..he.grayscale.is.labeled.in.micrometers.
Zernike coe
cient value
0.03
Astigmatism
0.02
Astigmatism
0.01
0
-
0.01
-
0.02
-
0.03
5
10
Zernike coe
cient index
15
20
25
FIGuRE 17.9
Zernike.coeicient.values.for.the.wavefront.shown.in.Figure.17.8..Astigmatism.is.labeled.