Biomedical Engineering Reference
In-Depth Information
(a)
N
=
12
N
=
16
N
=
20
N
=
25
Sys. Corr.
Sys. Corr. (3x)
x
-
y
x
-
y
x
-
y
x
-
y
x
-
y
x
-
y
x
-
z
y
-
z
x
-
z
y
-
z
x
-
z
y
-
z
x
-
z
y
-
z
x
-
z
y
-
z
x
-
z
y
-
z
(b)
1.5
7.0
40,000
Lateral FWHM
6.5
35,000
Max signal
Axial FWHM (
xz
)
Axial FWHM (
yz
)
6.0
30,000
1.0
25,000
5.5
5.0
20,000
4.5
15,000
0.5
4.0
10,000
5,000
3.5
0.0
3.0
0
Sys. Corr.
12
16
20
25
Sys. Corr.
12
16
20
25
Sys. Corr.
12
16
20
25
(c)
N
=
12
N
=
16
N
=
25
N
=
20
4
3
2
1
0
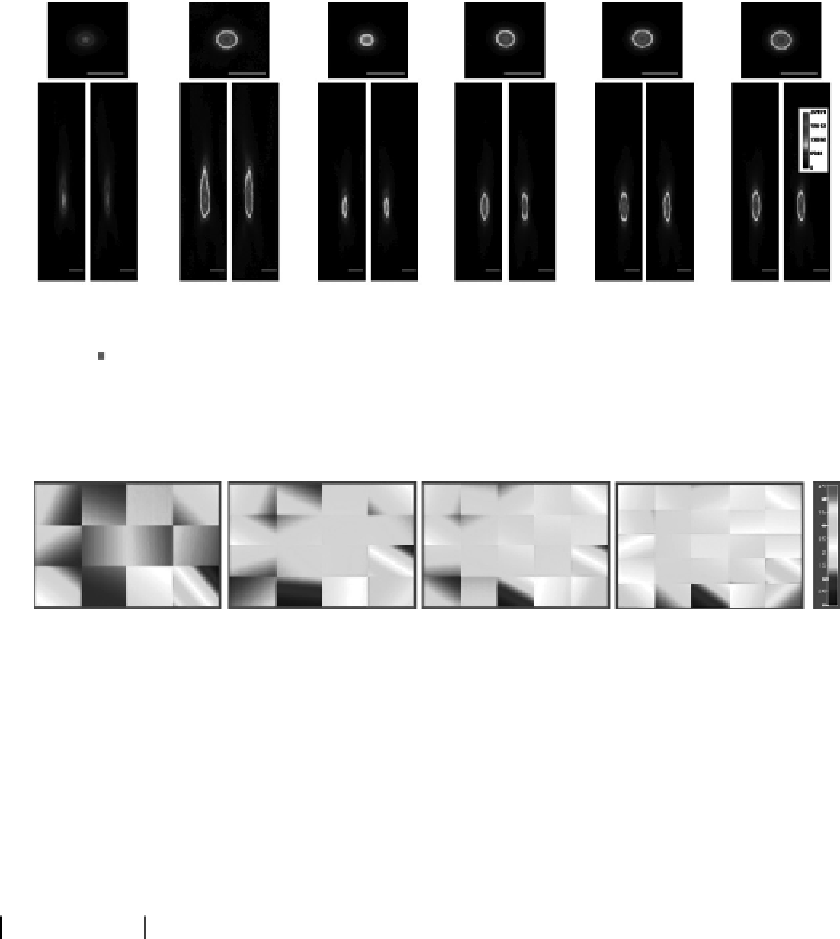
FIGuRE 13.13
(a).Lateral.(
top
).and.axial.(
bottom
).images.of.a.1.μm.bead.as.viewed.through.a.250-μm-thick.ixed.
mouse.brain.slice.under.diferent.correction.conditions..(b).Lateral.and.axial.FWHM.(full.width.half.maximum).
and. peak. signal. for. each. of. the. correction. conditions. in. (a).. (c). he. corrective. wavefront. in. units. of. wavelength.
(λ = 850 nm),.ater.subtraction.of.system.aberrations,.for.the.cases.
N
.=.12,.16,.20,.and.25,.obtained.using.the.indepen-
dent.mask.algorithm.with.direct.phase.measurement..Scale.bar:.2.μm..(Ji,.N.,.et.al.,.
Nat. Meth
.,.7,.2,.141-147,.2010.)
a.common.point.and.formed.a.near-difraction.limited.volume.within.which.two-photon.luorescence.
generation.is.largely.conined..he.signal,.however,.continued.to.increase,.indicating.greater.sensitivity.
of.the.two-photon.signal.to.even.small.wavefront.errors..his.is.hardly.surprising—for.a.point.object,.
a. phase. error.φ. in. the. electric. ield. over. a. small. fraction.
a
. of. the. rear. pupil. will. yield. a. signal. that. is.
1
4
ϕ
.of.the.optimal.value..For.example,.the.signal.is.more.than.halved.(41%),.even.if.only.
10%.of.the.wavefront.is.180°.out.of.correct.phase.
he. number. of. subregions. required. depends. on. several. factors—the. speciics. of. the. sample. under.
investigation,.the.parameter.being.optimized,.and.the.extent.of.optimization.desired..Because.we.cor-
rect. the. pupil. segment. by. segment,. our. zonal. approach. allows. an. initial. low-resolution. map. of. the.
aberrated. wavefront. to. be. made. at. a. modest. number. of. pupil. subregions,. and. only. then. do. the. areas.
suggestive.of.ine.structure.need.to.be.sampled.with.smaller.subregions..For.the.single-segment.illumi-
nation.method,.the.reduced.NA.of.excitation.ultimately.limits.the.number.of.subregions.into.which.the.
pupil.can.be.segmented.(which.is.not.a.problem.for.the.full-pupil.illumination.method)..Under.single-
segment.illumination,.one.can.densely.sample.the.wavefront.slope.at.the.pupil.while.still.using.relatively.
large.illuminated.subregions,.by.making.these.subregions.overlap.
.
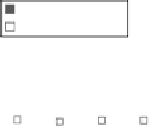
Figure.13.14
.shows.how.overlapping.
subregions.lead.to.more.distinct.(but.not.independent).pupil.areas..We.ind.the.method.illustrated.in.
Figure.13.14d.
to.be.particularly.useful,.for.it.produces.a.2D.array.of.local.wavefront.tilt.measurement,.
a
(
1
exp
(
i
))
−
−