Biomedical Engineering Reference
In-Depth Information
15,000
NoAO
Full
Single
Single Seg. AO
Full Pupil AO
No AO
12,000
9,000
6,000
3,000
0
2
4
6
8
10
12
14
16
Distance (
µ
m)
(a)
(b)
(c)
2.4
1.8
1.2
0.6
0.0
(d)
(e)
(f)
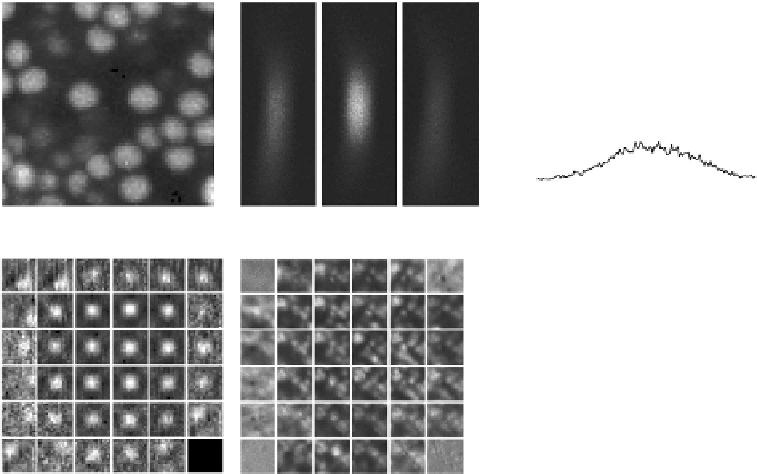
FIGuRE 13.9 (See color insert.)
. (a). Maximal. intensity. projection. across. a. depth. of. 30.μm. in. a. dense. sample.
of. luorescent. beads.. (b). Axial. images. of. a. 2. μm. diameter. bead. without. AO,. with. full-pupil. illumination,. and.
with. single-segment. illumination. AO.. (c). Signal. proile. along. the. dotted. line. in. b.. (d). Signal. modulation. during.
full-pupil.illumination.AO.for.diferent.pupil.segments..(e).Images.measured.with.single-pupil.illumination.AO..
(f) Aberration.in.units.of.wavelength..Scale.bar:.2.μm..(Milkie,.D.E.,.et.al.,.
Opt. Lett
.,.36,.21,.4206-4208,.2011.)
performance.was.again.attained.(
Figure.13.8e-h
)..Here,.the.pupil.was.segmented.into.6.×.6.subregions.
and.the.phase.was.obtained.by.direct.measurement..(he.discontinuities.incommensurate.with.the.6.×.
6.segmentation.were.caused.by.subtracting.a.7.×.7.segmented.system.aberration.)
he.above.examples.utilized.the.single-segment.illumination.approach..he.full-pupil.illumination.
approach.has.also.been.applied.to.a.nonbiological.sample.[11]..In.particular,.to.demonstrate.its.ability.
to.achieve.accurate.AO.correction.in.densely.labeled.samples,.we.prepared.a.dense.aggregate.of.2.μm.
diameter. luorescent. beads. in. agarose. (Figure. 13.9a). and. applied. an. aberration. pattern. on. the. SLM.
(Figure.13.9f)..While.the.full-pupil.illumination.AO.improved.both.the.signal.and.the.image.resolution.
(Figure. 13.9b. and. c),. correction. using. the. single-segment. illumination. actually. degraded. the. image.
quality.beyond.that.in.the.noncorrected.case,.due.to.the.confusion.caused.by.structures.originally.out.of.
focus,.which.led.to.erroneous.displacement.measurements.(Figure.13.9d.and.e).
13.4.3 Biological Sample examples
Interferometric. measurements. have. shown. that. aberrations. caused. by. biological. samples. are. much.
more. complex. than. what. is. typical. in. simple. nonbiological. samples,. due. to. their. extreme. optical.
inhomogeneity. [13,. 14].. However,. as. the. example. in.
Figure. 13.10
. shows,. even. segmenting. the. pupil.
into. 12. subregions. provided. a. signiicant. improvement. in. the. image. quality. of. a. 1. μm. luorescent.
bead.imaged.through.a.250.μm-thick.ixed.mouse-brain.cortical.slice..Indeed,.even.though.the.cor-
rective. wavefront,. with. a. peak-to-valley. value. of. four. wavelengths,. appeared. quite. disjointed,. our.
AO. correction. removed. the. ghost. images. and. improved. the. maximal. signal. by. fourfold.. For. most.