Biomedical Engineering Reference
In-Depth Information
mode 2 - tip
mode 3 - tilt
3
Wavefront measurement
- mouse oocyte cell
- Zernike mode representation
- objective lens: Zeiss 20x, 0.5 N.A.
- condensor lens: Zeiss 40x, 0.6 N.A. korr
- scan range 100
μ
m
×
100
μ
m
2
1
0
̶
1
̶
2
̶
3
mode 4 - defocus
mode 5 - astigmatism
mode 6 - astigmatism
mode 7 - coma
1
0.5
0
̶
0.5
̶
1
mode 8 - coma
mode 9
mode 10
mode 11 - spherical(1st)
mode 12
mode 2 - tip
mode 3 - tilt
4
Wavefront simulation
- model for a mouse oocyte cell
consisting of two concentric spherical
regions
2
0
̶
2
̶
4
mode 4 - defocus
mode 5 - astigmatism
mode 6 - astigmatism
mode 7 - coma
1
0.5
0
̶
0.5
̶
1
mode 8 - coma
mode 9
mode 10
mode 11 - spherical(1st)
mode 12
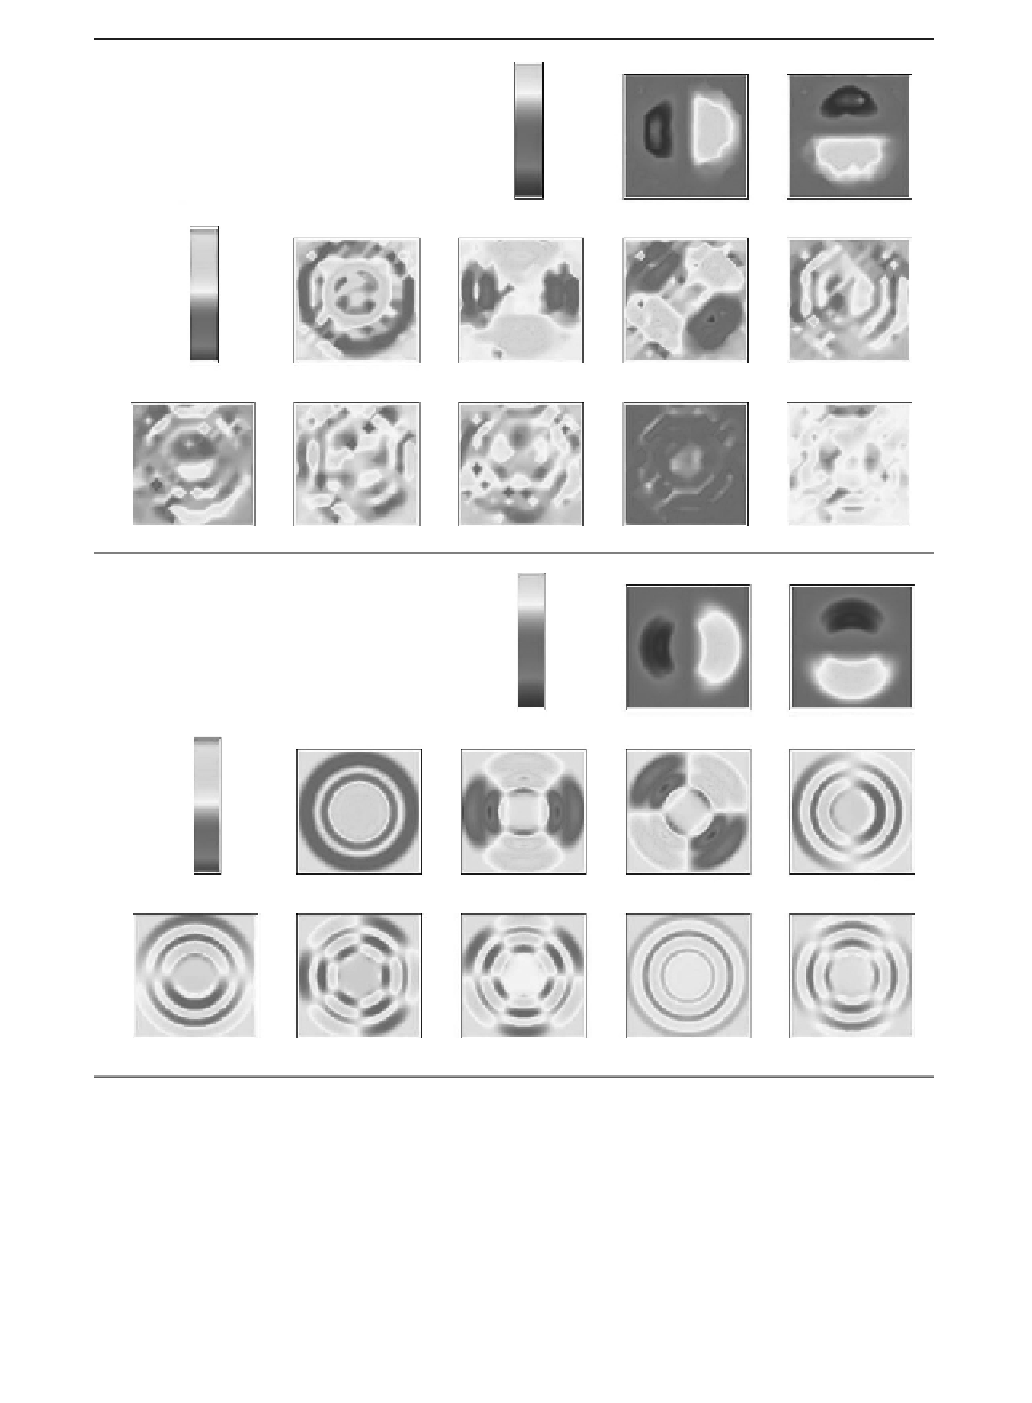
FIGuRE 6.5
Variation. of. the. Zernike-mode. amplitudes. of. the. aberrated. wavefront. across. the. ield. of. view..
Experimental. results. for. the. wavefront. measurements. of. a. mouse. oocyte. cell. (top). and. corresponding. simula-
tion.results.(bottom)..In.the.experiment,.the.specimen.was.translated.and.wavefronts.were.recorded.on.a.grid.of.
16 ×.16.points.across.the.specimen..For.the.simulation,.four.times.the.number.of.data.points.are.calculated.on.a.
32 × 32 grid.