Biomedical Engineering Reference
In-Depth Information
Y
X
-
Y
Plotter
X
DVM
Thermo-
couple
2
Buffer DC subtractor
-
-
Boonton
72B
Peak
limiter
Bias
input
1
+ 1
3
DC
supply
÷ 2
Sample
a
Insulated
chamber
PAR 160
Trigger
Pulse
generator
Trigger
PAR 160
b
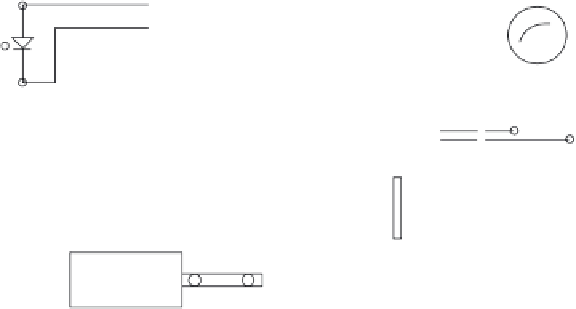
FIGURE 6.12
Block diagram of the DLTS measurement system.
on the electronic and optical defects in a material. These two capacitance
techniques provide information on defect activation energy, capture cross
section, and density. Figures 6.12 and 6.13 show the DLTS and C-T block
diagrams.
Photoluminescence is an invaluable tool providing information on crystal
uniformity, impurities, optical efficiency, and energy band gap for direct-gap
DVM
DVM
Thermo-
couple
DC
offset
Boonton
72B
Trigger
O-scope
Sample
Bias
circuit
Biomation
805
Insulated
chamber
X
Y
16-Bit
BUS
HP-IB
HP-9:825
Plotter
Interface
FIGURE 6.13
Block diagram of the C-T measurement system.


Search WWH ::

Custom Search