Biomedical Engineering Reference
In-Depth Information
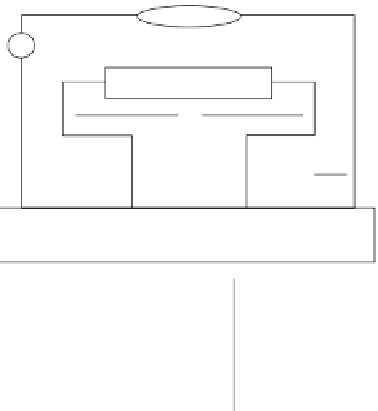
Constant current source
I
Potentiometer
V
r
a
a
a
Sample
V
r
I
R
s
=
ρ
V
r
π
Thick samples: ρ = 2 π
a
=
t
n
2
I
V
r
I
V
G
V
r
n
2
t
= ρ
Thin samples: ρ =
C
(
t
/
a
)
π
R
G
FIGURE 6.7
Four-point probe measurement of resistivity.
Spreading
resistance
electrodes
Measurement
starting
position
Implanting ion
beam direction
Lapped
surface
Original
surface
5.7° Angle
Implanted
region
1
N
(
X
) =
qp
(
X
)µ[
N
(
X
)]
R
sp
=
P
1
2
a
f
[
d
/2
a
;
P
11
P
21
...
P
n
]
FIGURE 6.8
Spreading resistance measurement.
resistance
R
at that location, the electrodes are advanced to the right in small
steps. Steps of 5 μm, for example, correspond to measurements at depth
increments of 0.5 μm.
The expected resistivities for GaAs tests are much less than for sili-
con. They run from about 0.12 × 10
−2
to 8.8 × 10
−2
Ω-cm in undamaged and


Search WWH ::

Custom Search