Biomedical Engineering Reference
In-Depth Information
which are within a few percent for
p
2
> 0.5, although Goell indicates a “fan-
ning out” to the left on the curves for small
p
2
.
An analysis performed by Bradley and Kellner [4] was used to verify the
accuracy of Marcatili's approach as applied to carrier compensated wave-
guides. The numerical analysis program uses cubic spline functions in a finite
element analysis. The comparison indicates essentially perfect agreement
with the modal structure and cutoff conditions predicted by the Marcatili
analysis (excepting very small
p
2
values), so that the ease afforded by the use
of Marcatili's approach does not significantly compromise the accuracy or
choice of fabrication parameters.
5.3 ModesoftheChannelWaveguide
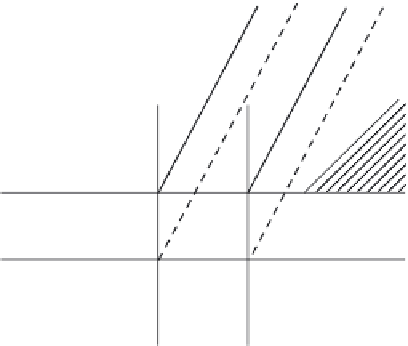
The basic channel structure is shown in Figure 5.5. In many cases of interest,
n
3
=
n
4
=
n
5
<
n
1
and
n
2
=
n
1
; however, the more general case will be discussed
first. A simplification at this point enables a closed form solution. The key
assumption is that the modes are well above cutoff, so that the field decays
exponentially in regions 2, 3, 4, and 5, with most of the power traveling in
region 1. Very little power travels in the shaded regions of Figure 5.5 so that,
by not matching the fields along the edges of the shaded areas, we are not
significantly affecting the calculation of fields in region 1.
The modes are essentially of the TEM type and can be grouped into two
families,
E
p
x
and
E
p
y
, with
p
and
q
indicating the number of extrema in the
field distributions in the
x
- and
y
-directions, respectively. The transverse
field components of the
E
p
x
modes are
E
x
and
H
y
, while those of the
E
p
y
modes
n
2
y
z
n
5
n
3
x
n
1
n
4
FIGURE 5.5
Ion-implanted channel waveguide structure.


Search WWH ::

Custom Search