Biomedical Engineering Reference
In-Depth Information
(a)
(b)
D0
D0
(M)
(C)
(P)
D28
D28
(C)
(P)
(M)
D49
D49
(P)
(M)
(C)
4
(e)
(c)
(d)
D49
D28
2PEF
SHG
Exc.
Y
3
Control
C
1/4
P
M
X
2
1/4
Z
Z
1/2
1
0
200 µm
0.00
0.20
0.40 0.60
SHG density in cortex (%)
0.80
1.00
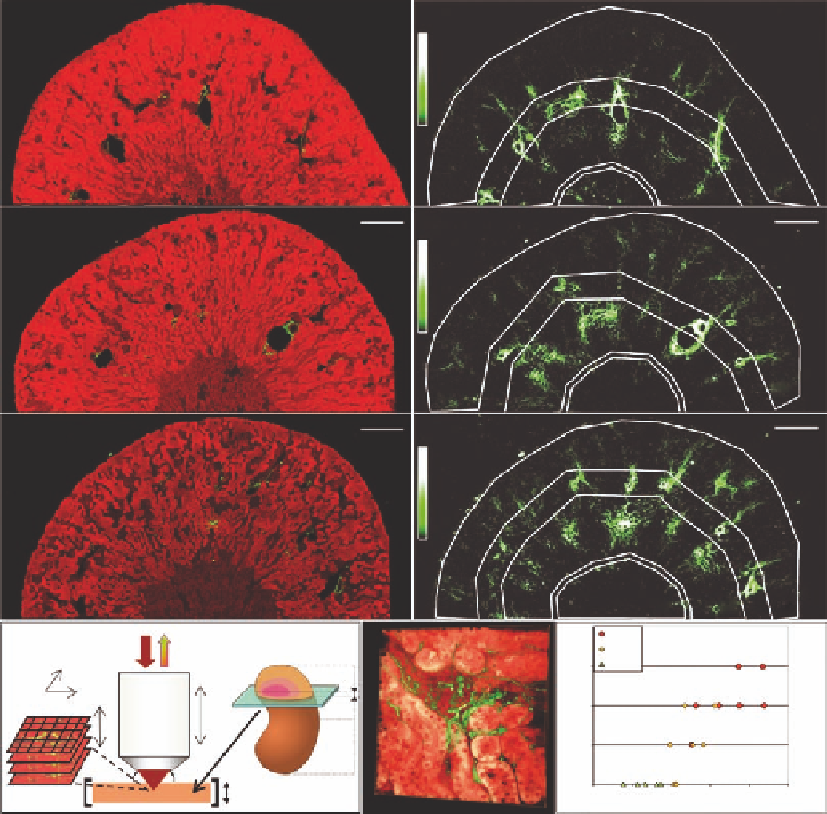
Figure 15.3
Multiphoton images of fibrotic murine kidney tissue. (a) SHG/2PEF and (b) segmented SHG images
of coronal renal section from a control, 28-days, and 49-days Angiotensin II infused mouse showing renal papilla
(P), medulla (M), outer cortex (C), and arcuate arteries along the boundary between cortex and medulla. SHG
(green color) reveals collagen fibers in the tubular interstitium and in the arterial adventitia, and 2PEF (red color)
underlines tubules. These 4.8 × 2.4 mm
2
images are obtained by stitching 10 × 20 laser scanned images (dimension:
270 × 270 μm
2
, pixel size: 0.8 × 0.8 μm²) acquired sequentially by moving the kidney sample with a motorized
microscope stage. Scale bar: 500 μm. The white lines underline segmentation used for SHG scoring (excluding the
artery region and the borders). (c) Scheme of the laser scanning multiphoton microscope showing epidetection of
z
-stacks of SHG/2PEF images and kidney coronal slicing for multiphoton microscopy. (d) 3D reconstruction show-
ing interstitial fibrosis (270 × 270 × 40 μm
3
with 0.4 × 0.4 × 0.5 μm
3
voxel size). (e) Automated SHG scoring of cor-
tical fibrosis plotted as a function of a semi-quantitative estimate of interstitial damage for control and hypertensive
mice. Both scores are correlated (
τ
= 0.68,
p
< 0.01). (From Strupler, M. et al. 2008.
J. Biomed. Optics
13:054041.
With permission of SPIE.)