Biomedical Engineering Reference
In-Depth Information
(a)
Active cluster size (nm)
80
(b)
20
40
60
100
120
100
10
12
9
80
6
10
8
60
3
10
4
0
40
120
180
240
300
10
0
20
Point V
0
20
40
60
80
0
100
150
200
250
300
Angle of fibril
wrt
optic axis
Collagen fibril thickness (nm)
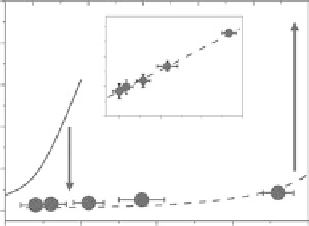
FIgurE 17.1
Collagen
F
/
B
SHG ratio varies with fibril diameter and orientation in the
z
-axis. Collagen (a)
fibril diameter and (b) orientation with respect to the
z
-axis determine the effective fibril diameter in the optical
axis, which in turn affects the
F
/
B
ratio, with the
F
/
B
ratio increasing with increasing effective fibril diameter.
However, the relationship between fibril diameter (as determined by atomic force microscopy) and
F
/
B
is complex,
as detailed in Ref. [31]. In (a), solid circles are measured as
F
/
B
ratio relative to collagen fibril thickness. If all the
collagen molecules act as active SHG scatterers, the calculated
F
/
B
ratio is plotted as the solid line. The dashed
line is
F
/
B
calculation based on active cluster sizes, indicating that only a fraction of the collagen molecules inside
a fibril produces SHG effectively. (a, inset) An empirical linear relation on
F
/
B
ratio over collagen thickness is
obtained. Panel (b) represents
F
/
B
SHG as a function of fibril angle to the optical axis. (b, inset) The expected SHG
intensity profiles from variously oriented rods. (Panel (a) and its legend are reprinted from Chu, S.W. et al. 2007.
Thickness dependence of optical second harmonic generation in collagen fibrils.
Opt Express
,
15
:12005-12010,
Copyright 2007. With permission of Optical Society of America; Panel (b) and its legend are reprinted with per-
mission from Zipfel, W.R. et al. Live tissue intrinsic emission microscopy using multiphoton-excited native fluo-
rescence and second harmonic generation.
Proc Natl Acad Sci USA
,
100
:7075-7080, Copyright 2003, National
Academy of Sciences, USA.)
endeavored to infer the
initial
emitted
F
/
B
ratio (our
F
i
/
B
i
here, to describe the initial emitted
F
/
B
SHG
directionality is equivalent to the
F
SHG
/
B
SHG
designation used in Chapter 6).
In this manner, with consideration to the other factors described above, the
F
/
B
ratio can provide
some indication of the overall spatial distribution and orientation of collagen fibrils, which as we sug-
gest above may have diagnostic value in differentiating normal versus cancerous tissue. In this section,
we will review several literature reports that have specifically analyzed
F
/
B
ratios in cancer tissues as
a means of distinguishing tumor stroma from healthy stroma, after which we will highlight several
technical instrumentation advances intended to facilitate the collection of
F
/
B
data from thicker tissue
sections.
17.1.2
F/B
Measurements in tumor tissue
Numerous reports have investigated differences in tissue collagen SHG signal in cancerous versus nor-
mal tissue (see [25] and references therein), but to our knowledge, only a few reports have looked
specifically at collagen
F
/
B
ratios in cancer tissue. In one report using mouse tumor models, Han et al.
found morphologic differences in collagen organization between healthy and tumorous murine mam-
mary tissue, with healthy mammary tissue displaying more delicate and evenly distributed collagen
fibers compared to the thicker bands of collagen observed in tumor-implanted murine mammary fat
pads [1]. However, they found no statistically significant differences in collagen
F
i
/
B
i
ratios between the
normal and tumor-implanted murine mammary fat pad tissues. In this study, the unknown collagen
F
i
/
B
i
ratio was indirectly measured by normalizing the detected collagen
F
/
B
to the detected
F
/
B
from