Biomedical Engineering Reference
In-Depth Information
SHG raw image
Vignetting correction Background correction
Blurring filter
SHG mask
> Threshold
Substraction
of 2PEF/K
+
C
Divised
by
× Mask
SHG
corrected
image
2PEF raw image
Vignetting correction
SHG/2PEF
corrected
image
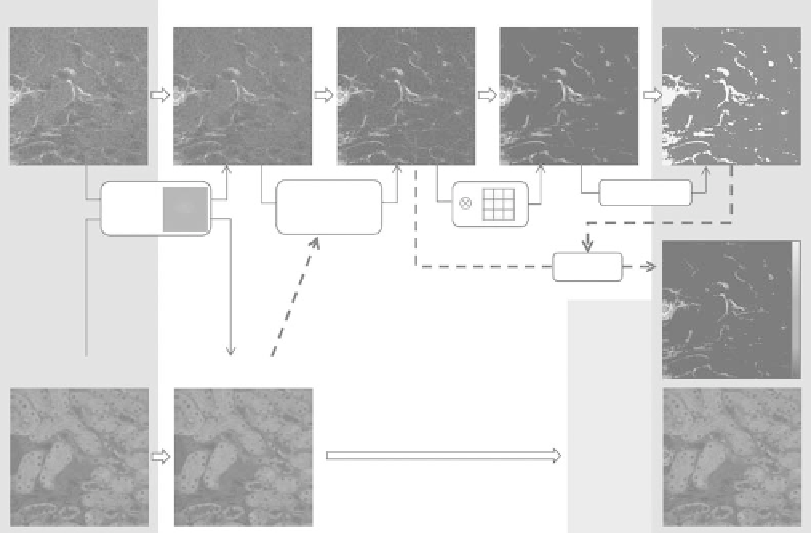
FIgurE 15.9
Algorithm for SHG data processing showing corrections for vignetting and background, filtering
to enhance fibrillar structures, and application of a threshold. We obtain a mask of the fibrosis extent, an SHG cor-
rected image and a combined SHG/2PEF image. (From Strupler, M. et al., 2008.
J. Biomed. Optics
13:054041. With
permission of SPIE.)
in the SHG detection channel (Strupler et al. 2007). It can be corrected for by subtracting a few percent
of the 2PEF image to the SHG image. The quantity of the 2PEF image to be subtracted can be determined
either from the spectral response of the detection channels compared to the fluorescence spectrum of
the tissue, or from image analysis in a region with no collagen fibrils (Strupler et al. 2007). Optical noise
due to ambient light is also subtracted if necessary.
15.4.3.3 enhancement of Fibrils' contrast and Application of a threshold
After the latter corrections, the SHG image displays fibrillar structures spread out over a salt and pep-
per background (due to shot noise when using photon-counting photomultiplier tubes). The surface
area of this nonsignificant background may not be negligible compared to the SHG signal from sparse
collagen fibrils in a low-grade fibrosis. It is better to be filtered out using a blurring filter (3 × 3 in Figure
15.9) before application of a threshold. This procedure enhances the contrast from fibrillar structures
that contain low spatial frequencies compared to high-frequency background (Strupler et al. 2007).
Thresholding of the blurred image then yields a so-called SHG mask and multiplication of this mask to
the SHG image yields a gray-level SHG corrected image with no background. The latter image is finally
combined to the 2PEF corrected image to obtain a corrected multimodal image of the fibrotic tissue (see
Figure 15.9).
15.4.3.4 Fibrosis Scoring
Quantization of the fibrosis extent is obtained by calculating the surface density of the SHG mask
(D score). A second score is obtained as the average signal in the corrected SHG image (S score). The
ratio of the signal-to-density scores S/D yields a third score that corresponds to the average SHG signal
in fibrillar structures (SF score). Since fiber bundles show larger signals than thin fibrils, the latter score