Biomedical Engineering Reference
In-Depth Information
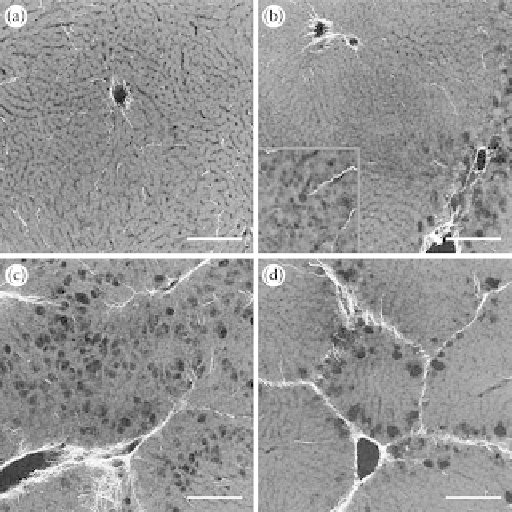
FIgurE 15.4
Morphological changes at different stages of liver fibrosis recorded with SHG and 2PEF microsco-
pies. (a) Collagen fibrils are uniformly distributed throughout the normal liver slice, and no necrosis (dark region)
is observed in 2PEF image. (b) Hepatocyte balloon degeneration appears around the central vein (pointed by the
white arrow) 3 days after CCl4 injection. Development of necrosis (dark areas) starts at this stage, which can be seen
in the magnified view at the bottom left corner. In addition, the amount of distributed collagen fibrils appears to be
decreasing as well. (c) Vacuoles caused by hepatocyte necrosis appear massively, and collagen tends to form septa
after continuous injection of CCl
4
for 14 days. (d) Bridge fibrosis is formed after injection for 21 days. 2PEF is shown
in dark gray, SHG is in gold, and the scale bars shown are 200 μm. (From Sun, W. X. et al. 2008.
J. Biomed. Optics
13:064010. With permission of SPIE.)
a quadratic behavior as a function of the collagen concentration obtained from the 2PEF signal that is
characterized by a linear dependence with the molecular density.
15.3.2.3 Multimodality and Versatility
SHG microscopy is a highly versatile technique that requires no specific tissue preparation. It applies
to
in vivo
or
ex vivo
intact tissues, to frozen tissues, to fixed tissues using ethanol, acetone, PFA or
any other fixation method and to paraffin-embedded sections. SHG imaging is therefore compatible
with any specific protocol aiming at visualizing specific components of the tissue, usually by use of
other multiphoton modalities. Indeed, SHG imaging can be easily combined with other multiphoton
modalities by taking advantage of their spectral difference: SHG appears at exactly half the excitation
wavelength whereas 2PEF is Stokes-shifted and THG appears at the third of the excitation wavelength.
Most importantly, SHG microscopy can be combined with 2PEF imaging of fluorescent constructs or
immunochemical labels to visualize proteins of interest or specific cells at the same time as the fibrosis
distribution within the tissue. This multimodal approach is highly interesting for fundamental stud-
ies aiming at deciphering fibrosis mechanisms since it enables tracking of cells that may participate in
fibrosis progression or location of proteins that may take in fibrosis signaling pathway. An example is
displayed in Figure 15.8 that shows a frozen unfixed section of a fibrotic murine kidney labeled with a
histidine-tagged green fluorescent protein (His
6
-Xpress-GFP). This fluorescent probe has been shown