Biomedical Engineering Reference
In-Depth Information
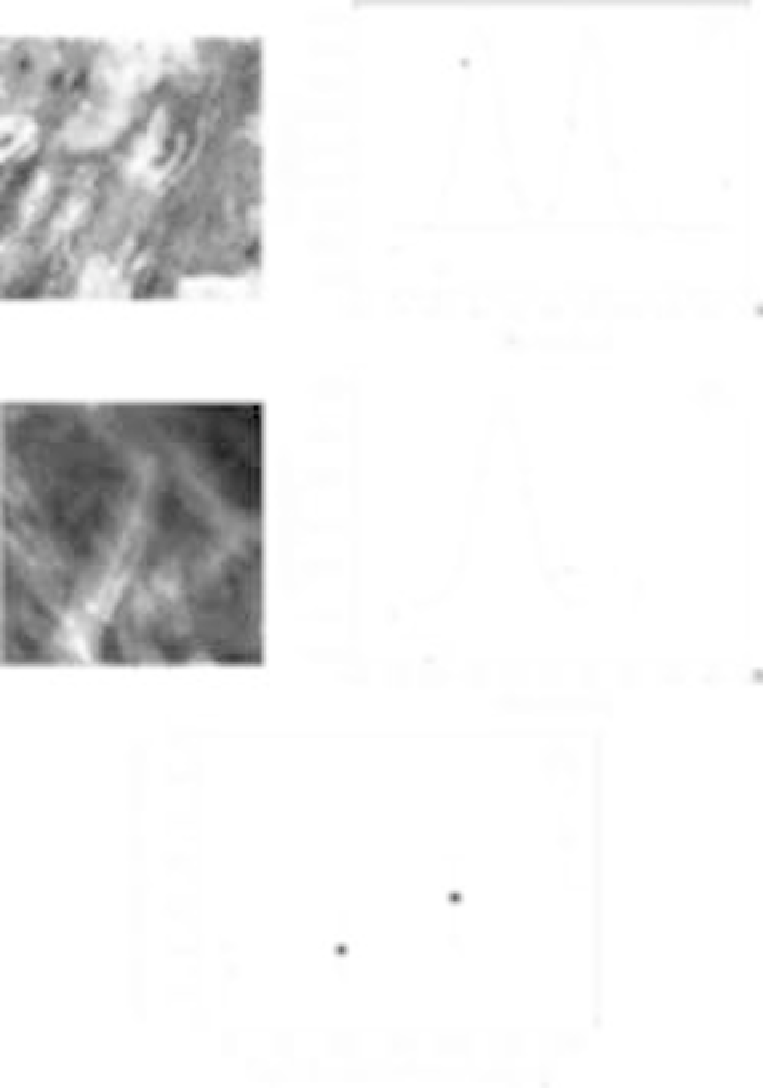
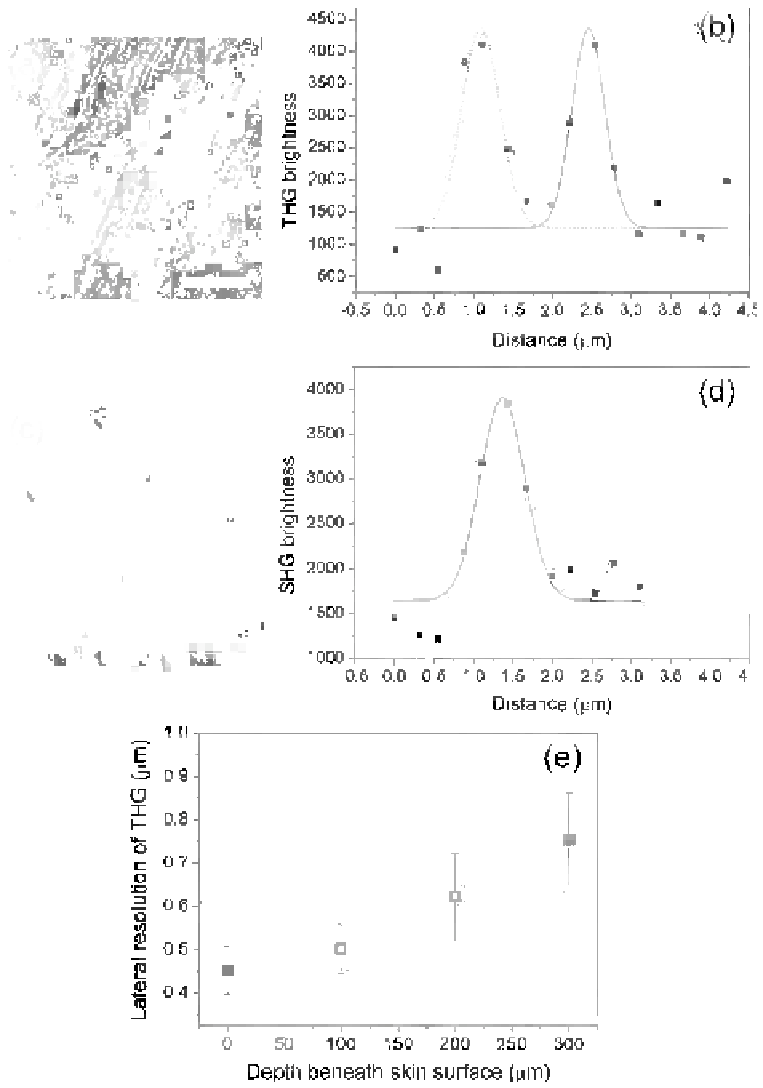
FIgurE 14.22
In vivo
(a) THG image of stratum corneum at right skin surface and (c) SHG image of reticular
dermis at 200-μm deep. The THG and SHG brightness versus distance along the yellow lines (arrows) were plotted
in (b) and (d), respectively, and fitted with Gaussian curves. SHG and THG are represented by green and purple
pseudocolors. Scale bar: 50 μm.