Biomedical Engineering Reference
In-Depth Information
dermis of skin (Tai et al. 2005; Chen et al. 2009a), the stroma layer of cornea (Chen et al. 2009b), and
the submucosa of oral cavity (Tai et al. 2006). On the other hand, the THG modality can generally pro-
vide morphological information to reveal the cellular structures of the skin, cornea, lens, oral mucosa,
cartilage, and so on. Moreover, it is found that THG can be enhanced by specific kinds of molecule like
hemoglobin (Clay et al. 2006; Tai et al. 2007; Chang et al. 2010), lipid (Debarre et al., 2006), and elastin
(Yu et al. 2007) through the mechanisms of real-level absorption resonance enhancement. Based on
these imaging contrasts, THG modality has the capability to reveal the RBC, adipocytes, and elastic
fibers and perform molecular imaging. In the following studies of the mouse tissues, SHG/THG micro-
scope with backward-collection geometry was used for investigation.
14.3.3.1 Mouse Skin
By optically sectioning excised mouse back skin at different depths, the cellular structures of the epider-
mis and the collagenous structures of the dermis can be revealed by THG and SHG modality, respec-
tively. Figure 14.12 shows an exampled series of epi-HGM images at different depths beneath the skin
surface of the mouse back skin (Figures 14.12a through 14.12h). Based on the strong SHG contrasts in
the dermal collagen fibers, the collagenous structures at the dermo-epidermis junction (Figure 14.12c),
in the papillary dermis (Figures 14.12d and 14.12e), and in the reticular dermis can be easily revealed
(Figures 14.12f through 14.12h). From the papillary dermis to the reticular dermis, the collagen fiber
bundles are found to become thicker and the collagen fibers become denser. At a depth of 80 μm (Figure
14.12g), the submicron spatial resolution is still preserved to distinctly reveal the collagen fibers. With
the SHG-revealed collagenous structures, the sketch of the hair follicle can be shown at a depth of
120 μm (Figure 14.12h). In the hair follicle, the hair root (arrow in Figure 14.12h) and the sebaceous
gland around it (arrowheads in Figure 14.12h) can be shown by THG modality. Since the sebaceous
gland is made of lipid-filled cells, the strong THG signals are contributed by the lipid in the lipid-filled
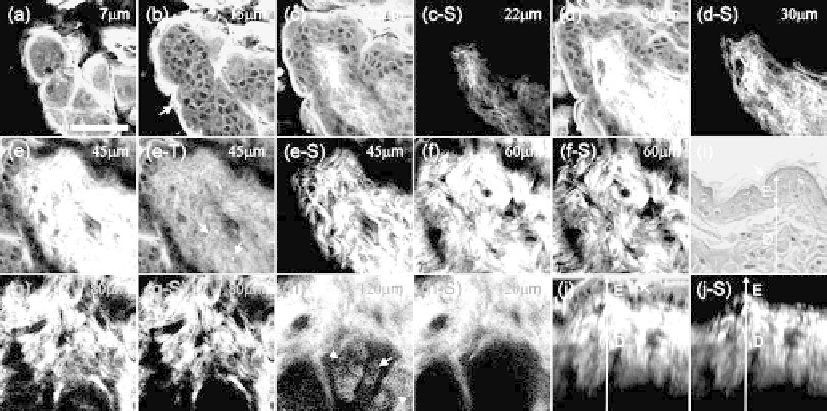
FIgurE 14.12
(a)-(h) An exampled series of SHG/THG images of the mouse back skin obtained at (a) 7 μm, (b)
15 μm, (c) 22 μm, (d) 30 μm, (e) 45 μm, (f) 60 μm, (g) 80 μm, and (h) 120 μm beneath the skin surface. The stratum
corneum (arrows) with ultrastrong THG contrast is shown in (a) and (b). The hair follicle with the hair root (arrow)
in it and the sebaceous glands (arrowheads) around it is shown in (h). (e-T) and (e-S) show the THG and SHG
images corresponding to (e), respectively, and the elastic fibers (arrows) in the dermis can be found in (e-T). (i) Axial
histology section with H&E staining and (j) axial epi-HGM image of the mouse back skin. he layer structures of
the skin, including the stratum corneum (arrows), epidermis (E), and dermis (D) are shown in both images. SHG
images corresponding to (c)-(h) and (j) are shown in (c-S)-(h-S) and (j-S), respectively. Scale bar: 50 μm.