Biomedical Engineering Reference
In-Depth Information
(a)
20 µm
5 µm
5 µm
(b)
(c)
80
6
14
p
= 0.8,
t-
test
5
12
Voltage change
(Soma)
SHG change
(Spine)
60
4
10
3
8
40
2
6
1
0
4
20
2
-1
0
0
-2
Soma
(
N
= 17)
Spine
(
N
= 15)
-10
0
10
20
40
Time (msec)
30
50
60
70
80
90
FIgurE 10.3
Membrane potential measurements at dendritic spines. (a) Visualization of dendritic spines by
SHG. The neuron in an acute brain slice was intracellularly stained with FM4-64 through a patch pipette and
SHG signals were visualized with laser illumination at 1064 nm. At higher magnifications, dendritic spines on the
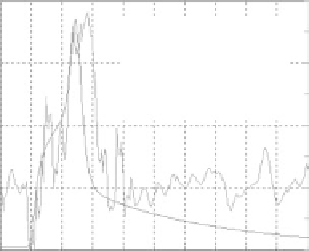
oblique dendrites can be clearly visualized by SHG. (b) Membrane potential measurements at dendritic spines.
Point-scan protocol at the dendritic spine revealed the SHG signal changes at the target spine (light gray) upon
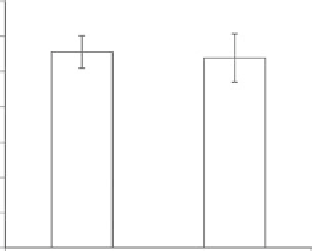
induction of action potential at soma recorded electrophysiologically (dark gray). (c) Comparison of SHG responses
at soma and dendritic spines. Peak amplitudes of SHG signal changes were compared between those obtained at
soma and those from dendritic spines, which revealed no significant difference in the membrane potential changes
in these locations. (Adapted, with permission, from Nuriya, M. et al. 2006. Imaging membrane potential in den-
dritic spines.
Proc Natl Acad Sci USA
103:786-790. Copyright 2006, National Academy of Sciences, USA.)