Biomedical Engineering Reference
In-Depth Information
256
(a)
(b)
(c)
Log
2
Log
2
128
64
32
16
8
4
2
1
Position (pixels)
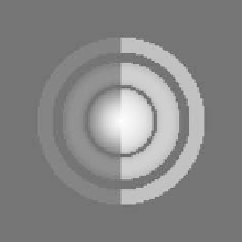
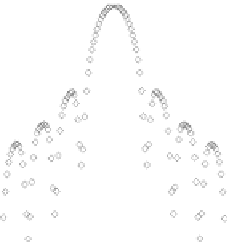
FIgurE 9.8
(a,b): Amplitude-contrast images of an Airy diffraction pattern recorded respectively with intensity-
based imaging and with holographic methods. The simulation supposed that in both cases, the image was recorded
in focus and that the detector returned a 8-bit depth image. Images are horizontally separated in two: the left part
has a linear grayscale colormap, the right part has a binary logarithmic grayscale colormap. (c) Comparison of the
amplitude profiles along the dashed lines in previous images. Diamonds (⋄) are from the holographic image and
squares (◽) are from the direct intensity image.
9.5.2 intensity images
While digital holography intrinsically retrieves the amplitude and phase of a complex wave ψ, an
intensity image
I
o
of the object wave can still be obtained from ψ, provided that the mutual coherence
function
g
o,r
and the intensity of the reference wave
I
r
are known. According to Equation 9.3,
I
o
is
ψ
2
2
I
=
(9.17)
o
g
I
o r
,
r
and quantitatively compares to the intensity of the object wave that any intensity-based detector would
have recorded.
Obtaining
I
r
is very easy. One simply has to record an intensity image of the reference wave by block-
ing the object wave. As the reference wave is quite obviously specimen independent, this is something
that needs to be done only once for a given holographic setup.
Retrieving
g
o,r
can be, however, more complicated. In the simplest case, that is, for a highly coherent
light source such as HeNe lasers,
g
o,r
is uniform and close to unity over the entire hologram. It can there-
fore be approximated to unity and
I
o
be deduced from ψ and
I
r
only. Unfortunately, this is no longer the
case when working with femtosecond lasers. With such low temporal coherence light source,
g
o,r
varies
a lot over the hologram and has to be precisely determined. One calibration procedure used to measure
g
o,r
consists in recording one hologram
I
and the intensities
I
o
and
I
r
of its associated object and reference
waves. Then, by reconstructing the hologram to retrieve ψ, one can deduce
g
o,r
from Equation 9.17. In
practice, such calibration is made only once for a given setup.
9.5.3 Phase images
The phase-contrast image is obtained by assigning the phase φ of the reconstructed wavefront to a
colormap.
9.5.3.1 Bright-Field Digital Holography Phase imaging
In bright-field digital holography, the phase provides a quantitative measure of the optical path length
difference light underwent in the object arm. However, it is important to mention that the reconstructed