Biomedical Engineering Reference
In-Depth Information
immersion objective. The secondary filter effect discussed earlier is evident here: the shortest emission
wavelengths are attenuated faster than the longer ones. There is far more red signal (560-650 nm) at a
depth of 125 μm (Figure 8.10c) as opposed to the depth of 25 μm (Figure 8.10a), where blue emission
(380-480 nm) dominates. Similarly, this can be seen from
XZ
cross section, where the fraction of red
signal increases with depth (Figure 8.10d).
The quantitative analysis of microsphere point-spread functions with respect to depth showed clear
difference between the oil and water immersion objectives. Although there is no difference in the
achievable depth of imaging, the depth-induced degradation in axial resolution can be eliminated if
oil immersion fluid (
n
= 1.515) is matched with a high refractive index OCA. For images taken with
water immersion objective (60× N.A. 1.2), a kidney sample cleared by OCA with refractive index of 1.34
had axial resolution just above 1 μm at 40 μm deep into the tissue (Figure 8.11a). Let us compare that
(a)
4
Refractive
index
3.5
1.34
3
1.40
2.5
1.51
2
1.34-ave
1.5
1.40-ave
1
1.51-ave
0.5
0
0
10
20
30
40
50
60
70
80
90
100 110
NFP (µm)
(b)
3.5
Refractive
index
3
1.34
2.5
1.40
2
1.51
1.5
1.34-ave
1
1.40-ave
0.5
1.51-ave
0
0
10
20
30
40
50
60
70
80
90
100 110
NFP (µm)
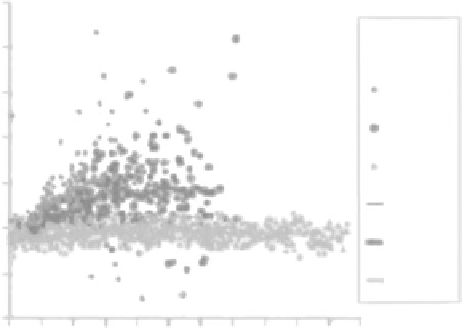
FIgurE 8.11
(
See color insert.
) Axial resolution as a function of depth into kidney tissue measured from two-
photon fluorescence of microspheres collected with (a) Olympus 60× NA 1.2 water immersion objective and (b)
Olympus 60× NA 1.4 oil immersion (
n
= 1.515) objective. The samples were cleared with agents of different refrac-
tive indices as shown in the right panels. (Young, P. A. et al. The effects of spherical aberration on multiphoton fluo-
rescence excitation microscopy. 2011.
J. Microsc.
242: 157-165. Copyright Wiley-VCH Verlag GmbH & Co. KGaA.
Reproduced with permission.)