Biomedical Engineering Reference
In-Depth Information
(a)
z
y
x
d
MT
d
N
E
1
0.9
0.8
0.7
0.6
0.5
0.4
0.3
0.2
0.1
(b)
Apical dendrite
Basal dendrite
0
50
55 60 65 70 75
Fraction of same-polarity microtubules (%)
80
85
90
95
100
(c)
0
0
1
0.5
1
1
0
0
2
π
0
2
π
ϕ
ϕ
Membrane sheet
Uniformly polarized
microtubules
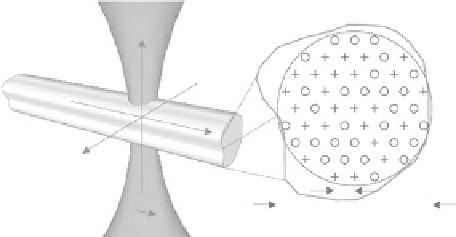
FIgurE 7.9
Numerical simulation of SHG intensity expected from a microtubule bundle. (a) Schematic of the
numerical simulation. The excitation beam, focused with high-numerical aperture objective, is linearly polarized
at the same direction as the microtubule long axis. The parameters including the number of microtubules, intermi-
crotubule spacing, and microtubule polarity were varied to calculate the effect on SHG intensity. (b) SHG intensity
has a quadratic dependence on the microtubule polarity as a result of coherent summation. With typical intermi-
crotubule distances and neurite diameters, the forward-emitted intensities were strongest in the order apical den-
drite > basal dendrite > axon > distal dendrite. The last two neurite types were plotted but were not labeled.) The
parameters used for the simulation were
d
MT
= 64 nm,
d
N
= 3 μm for apical dendrite,
d
MT
= 64 nm,
d
N
= 1 μm for
basal dendrite,
d
MT
= 64 nm,
d
N
= 0.5 μm for distal dendrite, and
d
MT
= 22 nm, and
d
N
= 0.17 μm for axon. (c) The
forward-emitting angular distribution of SHG intensity for scatterers arranged in two spatial configurations: on a
sheet such as a membrane, or in an array of tubular filaments such as in a neurite as depicted in (a). (Reprinted from
Kwan A. C. et al., 2008. Polarized microtubule arrays in apical dendrites and axons.
Proceedings of the National
Academy of Sciences of the United States of America,
105, 11370-11375. Copyright 2008, with permission from the
National Academy of Sciences, USA.)