Biomedical Engineering Reference
In-Depth Information
To decouple the forward SHG attenuation data provided in Figure 6.8 into relative conversion effi-
ciency, primary and secondary filter effects, we utilize the Monte Carlo framework used for the direc-
tionality. Mathematically, we account for the differences in χ
(2)
by the use of a smaller scattering cross
section σ in the simulation (see flowchart in Figure 6.1). Using the relative SHG conversion efficiency
ratio of 2.5:1 for WT versus oim, the resulting simulations (with standard error from the measured bulk
parameters) are illustrated in Figure 6.8 along with the experimental data. We observe that for both
the WT and oim, most of the depth points are characterized by overlap of the experimental and cor-
responding simulated data. The chi-squared test results in values of 0.07 and 0.28 for the WT and oim,
respectively, indicating that for both tissues, at the α = 0.05 level, the experimental and simulated results
are not significantly different.
This simulation demonstrates how the bulk optical parameters and relative χ
(2)
values strongly affect
the measured attenuation of the forward SHG for each tissue. Moreover, the use of simulations enables
us to isolate the relative effects of the contributing factors of the measured signal and establishes the sen-
sitivity of the various factors. Specifically, this approach would also allow us to determine relative SHG
conversion efficiencies between different tissues once the respective bulk optical parameters are known
at the fundamental and SHG wavelengths. This would be accomplished by running simulations varying
the relative conversion efficiency and then comparing the results to the experimental data to achieve the
best fit (in analogy with the directional data).
6.4.2 ovarian cancer
Here, we present the same analysis on human ovarian cancer as was shown for osteogenesis imper-
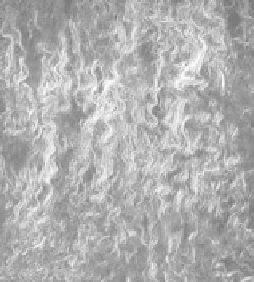
fecta above. Representative optical SHG sections for normal and malignant ovarian tissues are given in
Figure 6.9. The large difference in fiber morphology and collagen packing in malignant tissues suggests
that the scattering coefficient and scattering anisotropy may be different than that of the normal tissue.
The bulk optical parameters (μ
s
, μ
a
, and
g
) for the normal and malignant tissues at the laser (890 nm)
and approximate SHG (457 nm) wavelengths are given in Table 6.2. The malignant tissues are more
highly scattering at the SHG wavelength compared to the normal ones (267 vs. 172 cm
−1
), where this
difference was significant (
p
= 0.008). We interpret the higher scattering of the cancer to be indicative
that the matrix is more densely packed than the normal tissue. We point out that these measurements
were on fixed tissues, where the procedure will affect the absolute values of the scattering coefficient.
However, previous EM studies have shown that fixation does not significantly alter the fibrillar structure
and only results in a slight reduction in volume (~20%) [42]. We have also compared SHG images of fully
hydrated and fixed specimens of tendon and skin, and found that the fibrillar morphology was similar
Normal
Cancer
FIgurE 6.9
SHG single optical sections from normal and malignant human ovarian tissues. Scale bar = 25
microns. (Reproduced in part from Nadiarnykh, O. et al. 2010.
BMC Cancer
10:94.)