Biomedical Engineering Reference
In-Depth Information
(a)
7
6
Oim 100%
WT 100%
5
4
3
Oim 50%
2
WT 50%
1
0
0
10
20
30
40
50
60
Depth (microns)
(b)
2.5
2.3
2.1
1.9
1.7
1.5
1.3
1.1
0.9
0.7
Oim simulated
Oim experiment
WT simulated
WT experiment
0
10
20
30
40
50
60
Depth (microns)
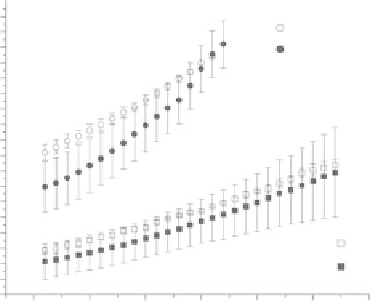
FIgurE 6.7
Comparison of experimental and simulated forward/backward response. (a) Representative Monte
Carlo simulations of the measured depth-dependent directionality (
F/B
) for the oim and WT skin with SHG cre-
ation emission directions of
F
SHG
= 100% and 50%. (b) Comparison of the Monte Carlo simulations of the oim
and WT
F/B
assuming 77.5% and 72.5%
F
SHG
creation emission for the oim and WT, respectively, with the experi-
mental data. The standard error in the simulations results from the standard errors in the bulk optical parameters
shown in Table 6.1 at the SHG wavelength. Chi-squared tests for both the WT and oim indicate that the respec-
tive experimental and simulated results are not significantly different. (Reprinted from
Biophys. J.
94, Lacomb, R.,
O. Nadiarnykh, and P. J. Campagnola, Quantitative SHG imaging of the diseased state osteogenesis imperfecta:
Experiment and simulation, 4504-4514, Copyright (2008), with permission from Elsevier.)
realizable as there will also be at least a small backward component due to the phase mismatch from
dispersion. In the current case, the skin fibrils are ~λ
SHG
/5 in diameter (70 and 100 nm for the oim and
WT, respectively) and, based on our phasematching model, are predicted to produce significant back-
ward SHG (but always smaller than the forward component). To estimate this value, we ran simulations
varying the ratio of the initial emission directionality from 40% to 100% (
F
SHG
) at 2.5% increments. We
use these simulations to fit to the initial directionality by squaring and summing the residuals between
the simulations and experimental data to calculate the
R
2
parameter. Taking the minimum of
R
2
then
yields %
F
SHG
of 77.5% and 72.5%, for the oim and WT, respectively, where the uncertainty in each case
is approximately ±3%, determined by the shallowness of this function around the minimum. The cor-
responding Monte Carlo simulations with standard error generated from the measured bulk optical