Biomedical Engineering Reference
In-Depth Information
the different values of γ associated with different protein conformations. A direct comparison of the
experimentally measured γ with the theoretically computed ones allows determining which modeled
protein structure is most representative of the conformation inside the tissue under investigation.
This approach can be used to interpret the muscle fibers SPA measurements shown in Figure 5.10 in
terms of myosin conformation. The atomic structures of actin (Figure 5.14b) and myosin (Figure 5.14c),
their polymeric organization in filaments, and the overall sarcomeric ultrastructure are known. In
detail, the atomic-resolution structure of full-length myosin can be reconstructed using the atomic
coordinates from the Proteins Data Bank: α-helix coiled-coil LMM and S2 (Blankenfeldt, 2006) and
double-headed rigor S1 (Chen et al., 2002).
Further, based on the thick filament structure, full-length myosin molecules repeated with the proper
axial periodicity and helical symmetry generate the quasi-helical 42.9-nm-long elementary unit con-
taining nine myosin molecules (see Figure 5.14d). The structure of the actin filament, on the other hand,
is published (Chen, 2002). In our calculations, a focal volume of ~1 fL contains 3.27 × 10
6
actin mol-
ecules (372 C-N HRSs per molecule) and 5.28 × 10
5
myosin molecules (4325 C-N HRSs per molecule).
Equation 5.12 can be used to estimate the
I
SHG
from knowledge of hyperpolarizability tensor; the depen-
dence of
I
SHG
on ψ can be accounted for by estimating an intensity indicator defined as
(
χ
( )
2
)
2
+
(
χ
( )
2
)
2
,
yxx
yyy
which considers the contributions from both parallel and perpendicular incident polarizations.
Using this approach, myosin contribution results in three orders of magnitude larger than that of actin
(see Figure 5.14e), in agreement with the experimental evidence of SHG as myosin based (see Section 5.5)
and with structural distributions of HRS emitters within proteins (as described in Section 5.6).
Furthermore, the results shown in Figure 5.15 highlight SPA sensitivity to the conformation of myo-
sin. The molecular origin of this sensitivity can be assessed by comparing the
I
SHG
from whole myosin
and headless myosin. As shown in Figure 5.14e, the contributions from the coiled-coil portions (LMM
and S2) quantitatively dominate myosin SHG. However, the small but not negligible (10% of the total)
contribution from the motor head (S1) can provide SHG with fine sensitivity to the orientation of myo-
sin motors.
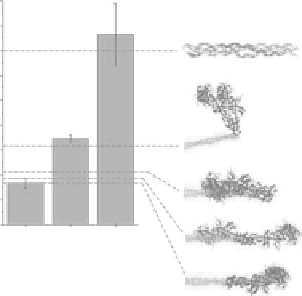
he γ
rest
and γ
rig
values can be interpreted in structural terms by implementing the model with con-
formational flexibility within the myosin molecule. Figure 5.15 shows a direct comparison between
γ values experimentally measured (gray bars) and computed for selected myosin conformations (dashed
lines). The γ
rig
value can be reproduced by the model only when the S1 heads are oriented about perpen-
dicularly to the fiber axis. In particular, the rigor conformation described by cryo-EM (Chen, 2002) and
1.8
1.6
1.4
1.2
1.0
0.8
0.6
0.4
0.2
0.0
FIgurE 5.15
Structural interpretation of SPA data. Modeling of γ from muscle and collagen. The bars show
experimental data (mean ± std): resting and rigor values were averaged over all recordings and sarcomere lengths;
the collagen experimental value was taken from tendon (see text). The dashed lines show values computed from dif-
ferent myosin conformations and from collagen. The structures on the right show the terminal segment of double-
headed myosin, with the fiber axis oriented horizontally.