Biomedical Engineering Reference
In-Depth Information
(a)
(c)
0.7
Force
Active
Resting
250 ms
1.0
0.6
0.5
0.5
0.0
0.4
0.3
0.2
100 kPa
2.0
2.5
3.0
3.5
4.0
SL (µm)
(b)
(d)
400
600
300
400
200
200
100
0
0
-1
0
1
2
3
ϕ
(rad)
4
5
6
7
8
-2
-1
0
1
ϕ
(rad)
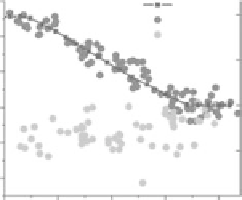
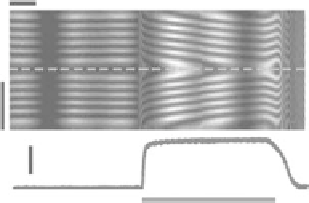
FIgurE 5.10
SHG polarization anisotropy (SPA) in intact muscle fibers. (a) Line scan measurement of SHG
intensity at rest and during tetanic contraction. The dashed gray line shows the point of inversion of scanning
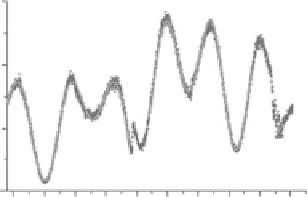
direction. The trace shows the force recording and the dashed line indicates the period of stimulation. (b) SPA
measurement: SHG intensity was measured from integration over each line of the scan. The best fit of Equation 5.14
to a portion of data covering a φ range of 2π for the resting (fitted γ
rest
= 0.351 ± 0.005) and the active state (fitted
γ
act
= 0.664 ± 0.005) is plotted but not visible due to perfect overlap with the experimental data. Panels a and b share
the same
x
-axis. (c) Measurements of γ versus sarcomere length (SL) in intact fibers at rest (light gray circles) and
during contraction (dark gray circles). The black squares and line represent the normalized force (right axis).
(d) SPA measurement in rigor (fitted γ
rig
= 0.691 ± 0.004). (Modified from Nucciotti, V. et al. 2010.
Proc Natl Acad
Sci USA 107
, 7763-7768.)
all myosin heads are attached to actin in a well-characterized conformation, corresponding to the end
of the power stroke. The measurement of SPA in rigor (Figure 5.10c, sarcomere length 2.2 μm) produces
a value (γ
rig
= 0.74 ± 0.02,
n
= 33) statistically different (
p
< 0.001) from γ
act
, further demonstrating that
SPA monitors the structural conformation of the acto-myosin cross-bridge. The molecular modeling
described in Section 5.7 will show how the SPA results can be used to infer information on molecular
conformation.
Another fundamental issue in the successful application of this technique to muscle pertains to the
spatial resolution. In this respect, a strong difference is observed between myofibrils and intact fibers.
In detail, SHG imaging is characterized by a much higher spatial resolution in myofibrils than in fibers
(see Figure 5.11).
The most likely explanation for this difference in resolution is that in myofibrils the diffraction-
limited spot of the laser elicits SHG from a spatially coherent population of molecules, whereas in fibers
myofibrils with different spatial phases are irradiated by the spot causing a loss of resolution. In myofi-
brils, a dark zone is visible in the middle of the bright bands (see Figures 5.11b,d). From sarcomere ultra-
structure, it is known that the center of the myosin-based A-band is characterized by the juxtaposition
of myosin filaments with opposing polarities, so that HRS emitters located within myosin molecule are
oriented in opposing senses, leading to the destructive interference of HRS signal.