Biomedical Engineering Reference
In-Depth Information
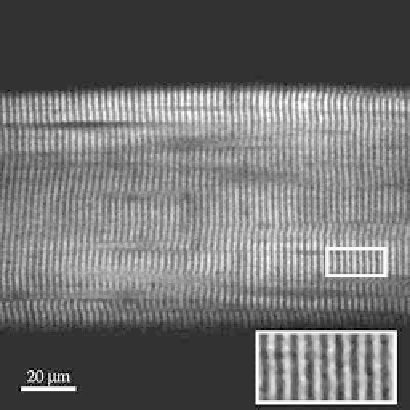
FIgurE 5.8
SHG image from skeletal muscle. SHG image of a single demembranated rabbit psoas fiber in rigor
(sarcomere length = 2.4 μm). The bright bands in the image correspond to sarcomeric A bands. The inset shows,
at 2.5× magnification, the area highlighted. (Modified from Nucciotti, V. et al. 2010.
Proc Natl Acad Sci USA 107
,
7763-7768.)
characterized by a high HRS. The possible molecular origin of SHG in the muscle has been studied in
several types of preparations; the first interesting indication came from the colocalization of the bright
SHG bands with the fluorescence from GFP-myosin heavy chain in nematode muscles (Campagnola
et al., 2002). Using mouse myofibrils, Plotnikov et al. (2006) showed that SHG signal does not colocal-
ize with either α-actinin (immunostained) or actin (labeled at the ends with rhodamine-phalloidin).
Another measurement relevant for the identification of SHG source consists in the extraction of myo-
sin: the extraction drastically reduced the SHG intensity of the bright bands, while not altering overall
actin organization in the sarcomere as imaged by two-photon florescence of rhodamine-phalloidin (see
Figure 5.9). These results suggested that the myosin filaments are necessary for the SHG signal but could
not resolve whether myosin alone could produce SHG or, rather, the myosin/actin lattice would be the
more likely source (Chu et al., 2004). This issue is addressed by the dependence of the width of the SHG
bright band on the length of the sarcomeres (Plotnikov, 2006). In a range of lengths in which the degree
of overlap between actin and myosin filaments changes linearly with the sarcomere length, the width of
SHG bright band does not show significant changes.
This result strongly supports the hypothesis that SHG arises entirely from the myosin-containing
band and does not require an overlap with actin filaments. On the other hand, myosin is the molecular
motor undergoing the structural changes responsible for muscle contraction and SPA measurements
can yield information on HRS orientation (via a geometrical parameter γ, as described above).
Therefore, the muscle tissue represents an excellent sample for testing the capabilities of SPA to
monitor molecular conformation
in vivo
. Clearly, the possibility of using SHG for the measurement
of myosin structural conformation relies on the location of the HRS emitters within the myosin mol-
ecule. In fact, this protein is constituted by a passive portion and a catalytically active actin-binding
ATPase (S1). Figures 5.10a,b show a direct comparison of SPAs from muscle at rest and during con-
traction. In this experiment line-scan SPA measurement (Figure 5.10a) was needed due to the limited
duration (≈1 s) allowed for tetanic contraction (trace in Figure 5.10a). Figure 5.10b shows a clear dif-
ference in the SPA profiles between resting and active, yielding a dependence of γ on the physiologi-
cal state: γ
rest
= 0.30 ± 0.03 (mean ± std,
n
= 7); γ
act
= 0.64 ± 0.02 (
n
= 7). Therefore, SPA results indicate