Biomedical Engineering Reference
In-Depth Information
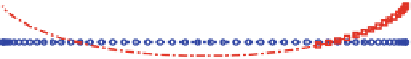
Fig. 8.3
Normalized
interfacial traction
distribution for different
values of the stress
concentration index (SCI) for
an adhesion patch with all
bonds closed. The normalized
pulling force
P=aF
b
r
0
¼
2
α=0
α=1
α=∞
10
1
10
0
-1
-0.5
0
0.5
1
x/a
ð
1
@
u
@r
¼
2
a
p
ru
r s
d
s
(8.8)
1
where
u ¼ ux=F
b
;
r ¼ x=a; r ¼ r
b
=r
0
,
s ¼ s=xF
b
r
0
¼ ru
, and
a
r
0
x
E
a ¼
(8.9)
The effect of
a
can be immediately understood from the solutions to (
8.8
)in
extreme cases. In the limit
a !
0, the solution is
sðxÞ¼
constant for a constant bond
distribution within the adhesion domain
a x a
, indicating a uniform distri-
bution of interfacial traction independent of the bond location
x
. In this limit, the
interfacial traction is equally shared among all bonds. In the opposite limit when
a !1
, the solution to (
8.8
) becomes
P
pa
1
1
x
2
sðxÞ¼
p
(8.10)
=
a
2
This is the classical singular solution for a 2D external crack [
60
]. For the
intermediate range 0
<a<1
, the maximum traction generally occurs at the edge
of adhesion and the minimum at the center. In the case that
r
b
¼ r
0
, Fig.
8.3
shows
that the interfacial traction is nearly uniform for small
a
values, while crack-like
stress concentration emerges near the adhesion edge for large
a
. Therefore, we refer
to
a
as the stress concentration index (SCI) [
40
]. Equation (
8.9
) shows that
a
is
linearly proportional to the adhesion size, the bond density, and stiffness and
inversely proportional to the reduced elastic modulus of cell and substrate. All
these factors play a role in controlling the distribution of interfacial traction within


Search WWH ::

Custom Search