Biomedical Engineering Reference
In-Depth Information
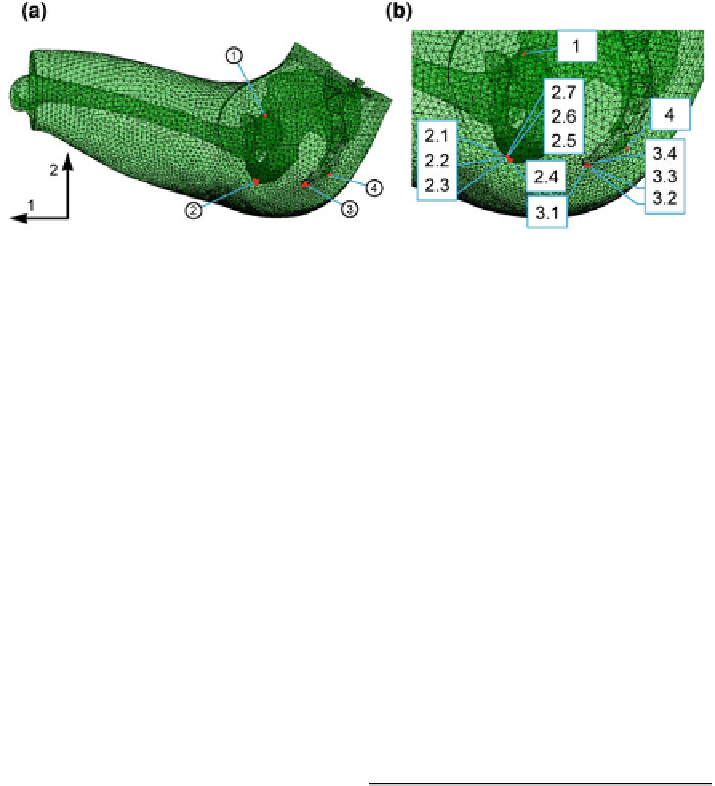
Fig. 7.66 Tissue peak stress locations due to mechanical interaction between buttocks and a seat
cushion, a overview (1: femur head, 2: ischial tuberosity, 3 and 4: tailbone), b image detail
showing locations of peak stress prior to (green) and after (red) topology optimization
Table 7.12 Assignment of peak stress
locations and peak stress
Position
Peak stress
1: Femur head
S
c
opt
22
; S
c
opt
33
2: Ischial tuberosity
2.1:
S
t
11
;
S
22
;
S
33
S
opt
12
min
;
S
opt
2.2:
13
min
S
opt
12
max
2.3:
2.4:
S
13
min
S
11
;
S
23
max
;
S
c
opt
11
;
S
opt
2.5:
23
max
2.6:
S
t
22
;
S
t
opt
22
2.7:
S
12
min
3: Tip of tail bone
3.1:
S
12
max
3.2:
S
t
opt
33
3.3:
S
23
min
S
t
33
;
S
13
max
;
S
t
opt
11
;
S
opt
3.4:
13
max
S
opt
23
min
4: Tail bone
The
VON
M
ISES
stress profiles of the ischial tuberosity-path (cf. Fig.
7.70
) show
local maxima at the fat-muscle interface and the muscle-fat interface (at approx.
24 and 43 mm tissue depth, respectively). Tissue stress S
ij
resulting from inter-
action simulation with the optimized seat cushion was significantly lower com-
pared to interaction simulation with the non-optimized cushion. In addition, from
the skin level to the muscle-fat interface, tissue stress was very low.
Comparing the stress values along the paths depicted in Fig.
7.69
b (tail bone tip)
and Fig.
7.70
b(ischial tuberosity) after seat cushion shape-optimization show that
stress values at the ischial tuberosity nearly double at the tail bone tip. Therefore, the
tissue stress distribution at the ischial tuberosity may be crucial to comfort analysis.