Biomedical Engineering Reference
In-Depth Information
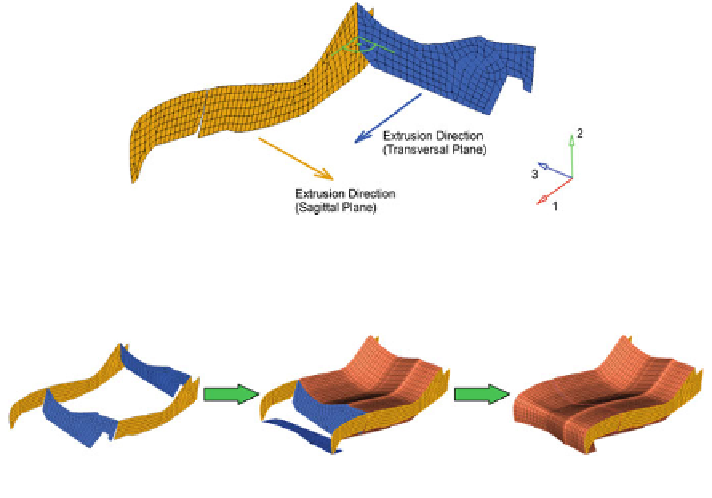
Fig. 7.61 3D-generation of an optimized seat surface based on both the transversally or
sagittally optimized contours
Fig. 7.62
Generation steps of the 3D-seat shape
transversal shape along the optimized sagittal contour or vice versa, cf. Fig.
7.61
.
The extrusion can be done manually or by partial automation, using appropriate
pre-processing tools.
In Fig.
7.62
, the generation of the 3D-shape is demonstrated using the example
of extruding the sagittally optimized shape along the transversally optimized
contour. Figure
7.63
shows the seat shape from different perspectives, as well as
together with a Boss-Model and seat structure.
7.3.1.4 Tissue Stress Analysis
Extrusion of the optimized 2D-seat cushion shapes led to two different 3D-profiles
which have identical upper (seat contact) surface contours, but different bottom
contours, cf. Fig.
7.64
. The profile generated from extrusion of the transversal
shape along the sagittal contour is referred to as ''transopt''. The profile generated
from extrusion of the sagittal shape along the transversal contour is referred to as
'' sagopt'' .
Both cushion profiles led to different tissue stress distribution at tissue locations
in the gluteal region (cf. Fig.
7.66
) in interaction simulation. The variation sagopt,
in contrast to variation transopt, resulted in higher peak tissue stress values of the
stress components S
ij
= S
ji
(i, j = 1, 2, 3) (cf. Table
7.11
), apart from one
exception highlighted in yellow in Table
7.11
.