Biomedical Engineering Reference
In-Depth Information
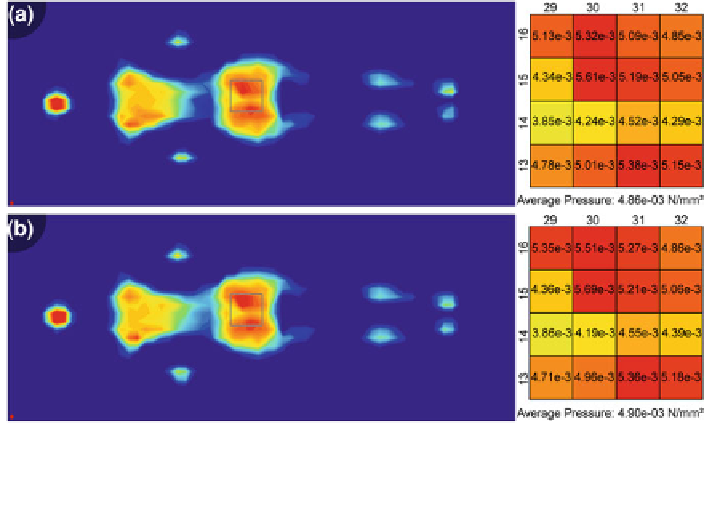
Fig. 7.26 Pressure distribution of the female volunteer on the H
ME
7 soft foam mattress at
a minimum membrane internal air pressure of approximately 10 mbar and b at maximum
membrane internal air pressure of approximately 20 mbar
7.1.7.3 Pressure Mapping Measurements Involving Foam Material H
ME
7
Figure
7.26
illustrates the pressure distribution between the female volunteer and
the bedding system LS2 employing the mattress foam material H
ME
7. Here, care
was taken that the subject body did not change position while the membrane
internal air pressure was increased. This was achieved since the location of the
head and buttock regions of maximum contact pressure did not differ. Again, an
increase in membrane internal air pressure led to only a slight increase in maxi-
mum interface contact pressure (+1.4 %).
Figure
7.27
depicts the pressure distribution for the male volunteer at minimum
and maximum membrane internal air pressure of 10 and 22 mbar. An increase of
membrane internal air pressure by a factor of 2.2 resulted in only a slight increase
of maximum contact pressure and mean pressure, +1.2 and 3.1 %, respectively.
7.1.7.4 Pressure Mapping Measurements Involving Foam Material
E
VO
P
ORE
HRC 150
P
Pressure mapping of the female volunteer and the bedding system LS2, employing
the mattress foam material E
VO
P
ORE
HRC 150
P
, at a minimum membrane internal
air pressure of 10 mbar and a maximum membrane internal air pressure of
20 mbar (22 mbar in the case of the male volunteer) showed similar results to
those previously depicted (Figs.
7.28
and
7.29
).