Biomedical Engineering Reference
In-Depth Information
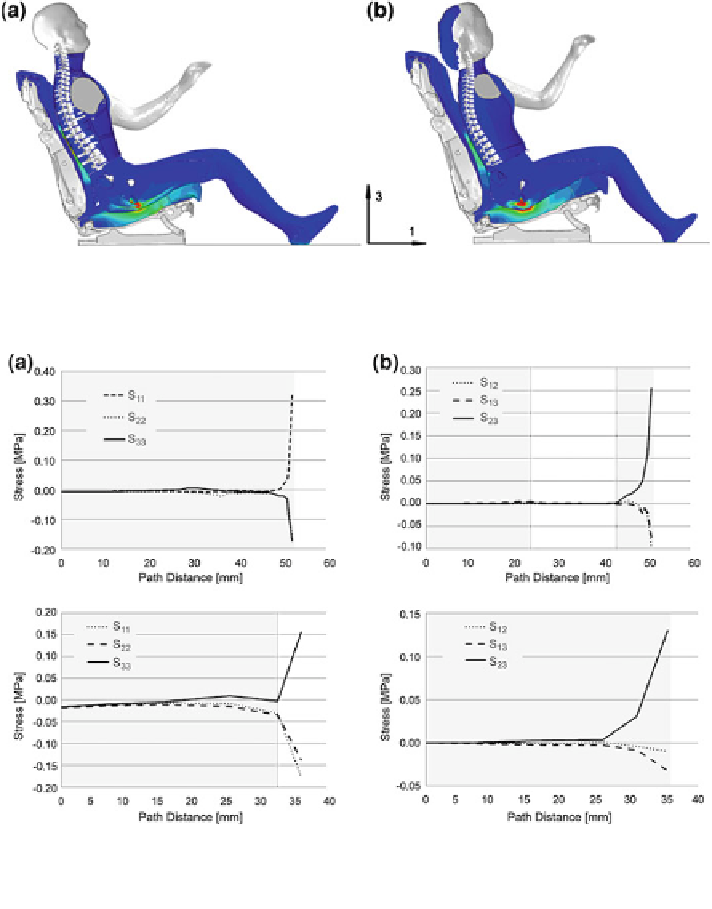
Fig. 6.42 Simulation of von M
ISES
equivalent tissue stress distribution for a E-BCSS 3 and b E-
BCSS 4 model in the sagital plane of the ischial region (section cut view)
Fig. 6.43 a Tissue direct stress S
33
and b shear stress S
13
along the defined node paths (see
Fig.
6.40
) initiating at skin level (0 mm) and leading to the bone surface (ischium) for E-BCSS 3
(top) and E-BCSS 4 (bottom); shading indicates skin/fat tissue depth at the investigated body sites
In Fig.
6.45
the paths are defined where stress is evaluated. Path 1 initiates at
skin level and traverses the fat layer and the muscle layer to the ischial bone
surface. Path 2 leads from skin level at the bottom side of the upper leg towards the
femoral bone surface.
E-BASS 1 (male model): In Fig.
6.46
the direct S
33
and shear stress S
13
distributions in the femur tissue are compared for the upright and the reclined seat
positions using the E-BASS 1 system. The tissue direct stress in the reclined