Biomedical Engineering Reference
In-Depth Information
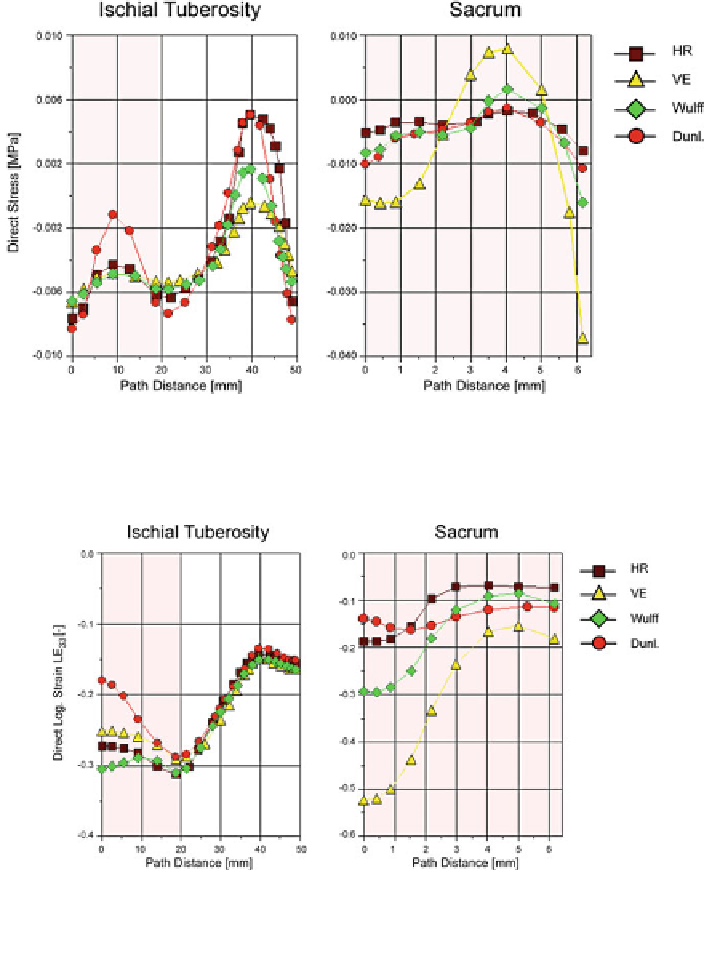
Fig. 6.16 Tissue direct stress S
33
at the ischial tuberosity and the sacrum on a path initiating at
skin level (0 mm) and leading to the bone surface (ischial tuberosity: 48 mm; sacrum: 6.3 mm).
Pink shaded region indicates skin/fat tissue depth at investigated siteso
Fig. 6.17 Logarithmic direct strain LE
33
at the ischial tuberosity and the sacrum on a path
initiating at skin level (0 mm) and leading to the bone surface (ischial tuberosity: 48 mm;
sacrum: 6.3 mm). Pink shaded region indicates skin/fat tissue depth at investigated sites
• Stress/strain distribution at the skin level (path distance = 0.0 mm) differs from
the internal tissue stress/strain distribution (path distance [ 0.0 mm),
• Tissue stress/strain distribution is dependent on the particular body support,
• Stress values at the sacrum exceed stress values at the ischial tuberosity by one
order of magnitude for the two employed foam materials,