Biomedical Engineering Reference
In-Depth Information
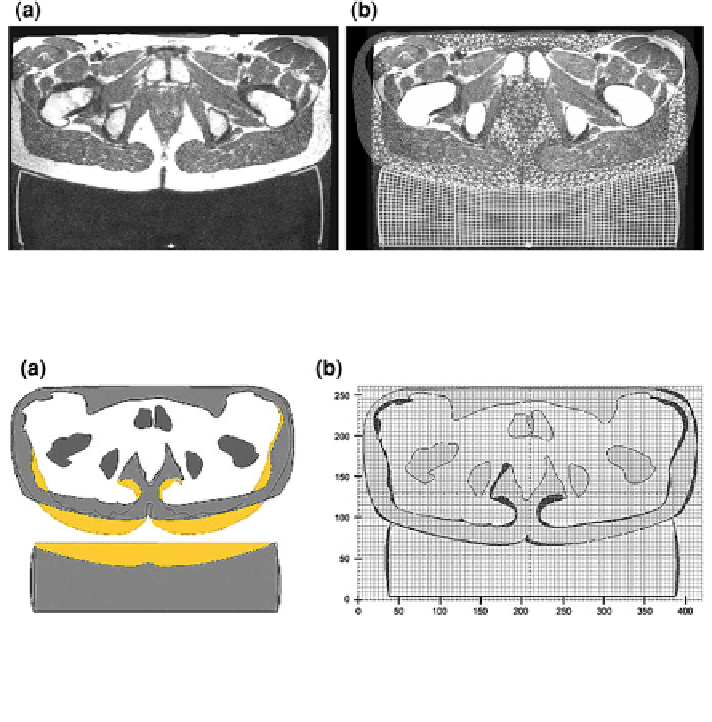
Fig. 6.10 Buttock cross section view with foam contour at the loaded state: a MR-image and
b superimposed MR-image and FE-mesh
Fig. 6.11 a In-plane overlay of transversal edge boundaries (fat, muscle, bone, foam support)
from reconstructed MR-images in the loaded (dark grey) and unloaded (yellow) configuration.
b In-plane overlay of experimental MRI results with simulation on squared grid: displacement
deviation in dark grey
In the loaded configuration with the foam specimen pushed onto the gluteal
tissue, the MR-image (Fig.
6.10
a) and the corresponding FE-simulation result
were superimposed (Fig.
6.10
b). Again, FE-muscle tissue has been omitted in the
overlay image to depict boundary matching. Gluteal fat and muscle tissue
deformation in the relevant region comprising buttock skin/fat tissue and the
gluteal muscle groups, showed good accordance with the experimental data.
Reconstructing the MR-image data of Figs.
6.9
a and
6.10
a and comparing both
deformed and undeformed configurations, Fig.
6.11
a shows that the gluteal tissue
and the foam support material are strongly deformed during the compression test.
Here, the deformed configuration is coloured in dark grey, whereas the initial
unloaded configuration is light grey. Fixed references in the overlay for the two
configurations of the gluteus were the bone structures. Colouring of muscle tissue
was omitted for clarity.