Biomedical Engineering Reference
In-Depth Information
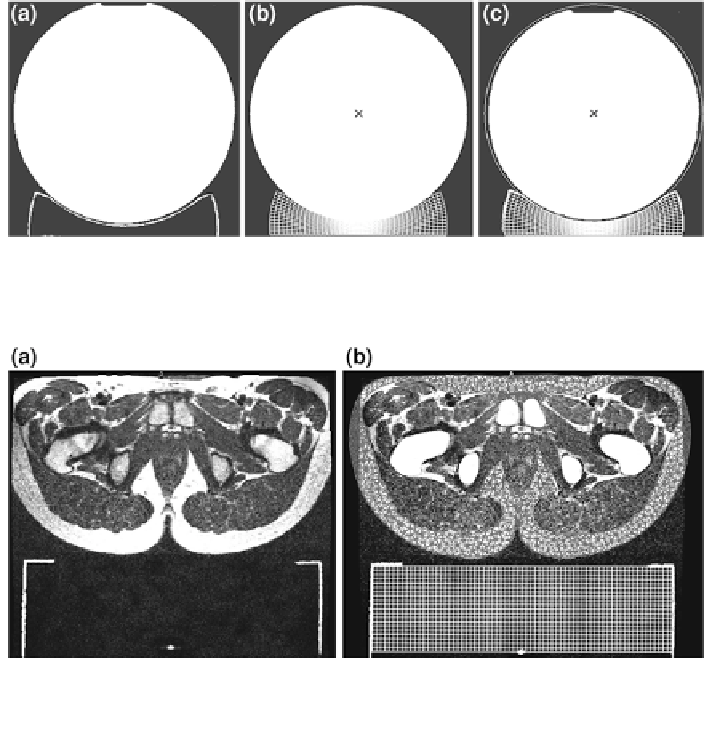
Fig. 6.8 Centre view: a MR-image of the foam specimen loaded with a sphere, b FE-simulation
result at steady state, c superimposed MR-image with FE-simulation
Fig. 6.9 Buttock cross section view with foam contour at the unloaded state: a MR-image of the
buttocks: fat tissue in white, muscle tissue in dark grey, foam contour: white lines, position
marker at bottom centre, b superimposed MR-image and FE-mesh
6.2.3.4 Verification of Buttock-Soft Foam Interaction
The contours of gluteal skin/fat and muscle tissue and foam specimen under
interacting contact loading obtained from MR-imaging were compared against the
FE-simulation results using Abaqus/Viewer
. For clarity, images depicted in
Figs.
6.9
and
6.10
were revolved about 180, in contrast to the experimental set up
previously described.
To show that the model of the initially unloaded configuration (Fig.
6.9
a) was
appropriately reconstructed and set up, the FE-model in cross-section and the
corresponding MR-image were superimposed at defined signal marker positions,
in Fig.
6.9
b positioned at the ischial tuberosity. The FE-bone structures are
depicted in white. The FE-mesh of fat tissue and foam appears as a dashed contour,
whereas the mesh of the muscle tissue has been omitted to clearly depict the
boundary match of the MR-image and FE-model.