Biomedical Engineering Reference
In-Depth Information
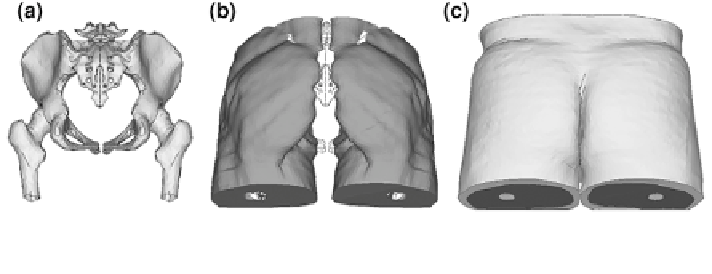
Fig. 6.7
Buttock FE-model: a bone structure, b gluteal and femoral muscle components, c skin/
fat tissue
continuum elements were used to model the foam specimen, and the constitutive
Hill model for non-linear, hyperelastic, isotropic, highly compressible materials
(3.274) (cf.
Sect. 3.2.6.4
) was used to describe soft foam behaviour. Bone structures
were assumed to be rigid and hip joints were fixed. Bones and adjacent tissue were
assumed to be rigidly combined. The musculature of the pelvic diagram was
modelled following the approach introduced in Then et al. (2008). The abdominal
cavity was assumed to be a homogenously filled and nearly incompressible con-
tinuum and tissue parameters close to those assigned for gluteal muscle were
assigned. Contact interactions were defined between skin surface and foam speci-
men, as well as between the skin surfaces of the intergluteal cleft.
The boundary conditions of buttock and foam specimen were defined according
to test conditions, i.e. abdominal skin surface nodes were fixed, whereas the bone
structure was free to move. Bottom surface foam specimen nodes positioned at the
foam fixation plate were displacement driven and free to move only in the vertical
loading direction.
Tissue-foam contact interactions according to the experimental conditions were
simulated performing a static analysis using the Abaqus
FE-Solver.
6.2.3.3 Verification of Polyurethane Soft Foam Material
As an additional verification of soft foam material behaviour under defined loading,
a MR-based test was introduced loading a foam sample with a plastic sphere. Visual
comparison was done by superimposing the MR-image at the centre position of the
sphere (Fig.
6.8
a) with the corresponding result obtained through FE-simulation
(Fig.
6.8
b) at section cut view. A good match was achieved, comparing the outer
foam specimen contour of the FE-result with the corresponding MR-image
(Fig.
6.8
c). The results indicate that the lateral straining of the compressed speci-
men could be modelled well with the derived soft foam material parameters. The
sphere exhibited a wall thickness of 3 mm which led to a detectable gap between
water filling and foam surface (cf. Fig.
6.8
a and c). In Fig.
6.8
c, for clarity, the FE-
sphere model is depicted as the boundary line encircling the MR-signal image
caused by the water filling.