Biomedical Engineering Reference
In-Depth Information
Table 5.9 Established Prony series parameters w.r.t. Eq. (3.342) representing transient gluteal
skin/fat and passive skeletal muscle tissue behaviour with loading direction transversal to muscle
fibre orientation
i
g
i
(-)
k
i
(-)
s
i
(s)
Skin/fat
1
1.33240411E-002
1.32003205E-002
2.0
2
3.64287819E-003
3.24971069E-004
40.0
3
3.85165666E-004
5.60416576E-004
80.0
4
1.59997251E-002
1.89029712E-005
200.0
Muscle
1
7.67035335E-001
1.16768944E-002
2.0
2
6.44394623E-002
2.29042100E-004
40.0
3
6.08481439E-004
3.73646787E-004
80.0
4
2.17789168E-002
1.28511319E-005
200.0
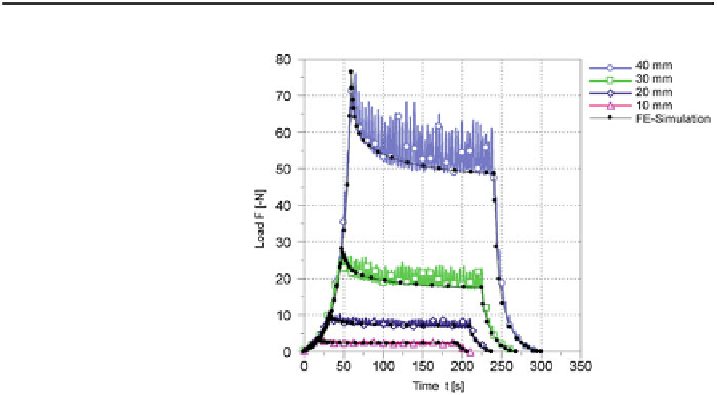
Fig. 5.32 Comparison of
simulation results and
relaxation test data
images of tissue deformation after the single ramp phase and corresponding time.
Parameter optimization was carried out by fitting the parameters to the case of
maximum tissue indentation, i.e. at 40 mm-ramp displacement, due to the most
distinct curve characteristics, i.e. distinct force descent. In the actual fitting pro-
cess, the filtered curve (Fig.
5.30
a) was used as a target function.
The models were employed in transient static simulation using the A
BAQUS
FE-solver to solve the boundary value problem. A four-term Prony series was
adopted for the viscoelastic formulation since shorter Prony series inaccurately
represented the experimental curves. The model function values, i.e. simulated
force-time data, were compared to the experimental relaxation data until agreeable
fit was achieved. Established Prony series parameters are provided in Table
5.9
.
Simulation Results: The approach was verified by recombining both models into
one model representing the fat-muscle-tissue compound, i.e. the actual anatomical