Biomedical Engineering Reference
In-Depth Information
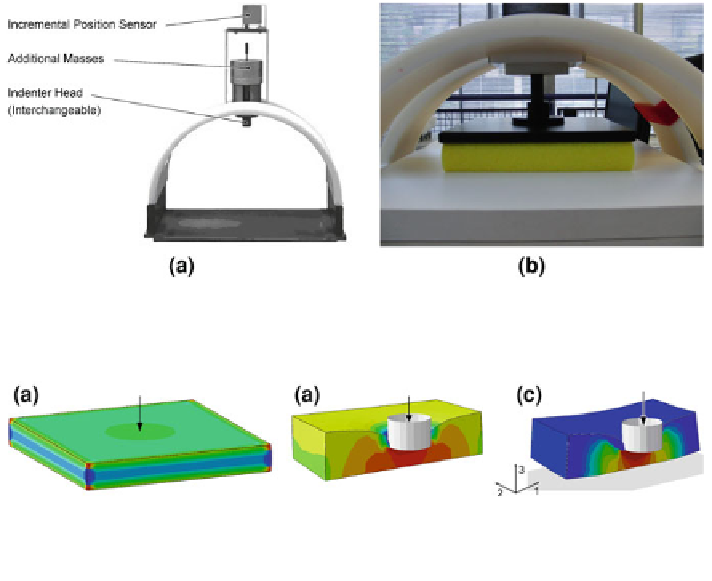
Fig. 4.14
a Loading device for creep characterization of elastomeric foams, b plate compression
test
Fig. 4.15 Shaded contour plots of direct stress of a the plate creep test model at time 10,800 s,
b and c the indenter creep test model with a cylindrical punch (section cut view) at time 10,800 s
(b HR-foam model and c VE-foam model); arrows indicate loading direction
compression test, multi-objective optimization was performed, taking both creep
tests into account (see
Sect. 3.4.2
)
.
Creep-Data: Creep testing was chosen along with stress relaxation tests since
the body support material was loaded with a constant body weight, due to gravity,
during body-support interaction (cf. outlines regarding creep behaviour in
Sect.
3.2.2.2
).
In the parameter optimization process, material data was fitted using a Prony
sensitive to the number of decades of time data (the information in the first second
of recording is as valuable as the information from 1 to 10 s), emphasis was laid on
proper data collection early in the experiments. Possible non-linear viscoelastic
effects of the examined foam materials were handled by capturing the time-
dependent foam material behavior in the operating range, corresponding to the
load case of body weight buttock loading on a soft foam device. Specifically,
dimensions of the test specimen were chosen, such that indenter contact stress
approximately corresponded to the stress to be expected in a buttock-support
interaction simulation. Sample height and contact area, as well as indenter weight,
were chosen accordingly.
Within the first minute indenter displacement values were recorded with a
sample rate of 50 Hz. During the remaining experimental creep time of 10,800 s
the sample rate was 20 Hz.