Biomedical Engineering Reference
In-Depth Information
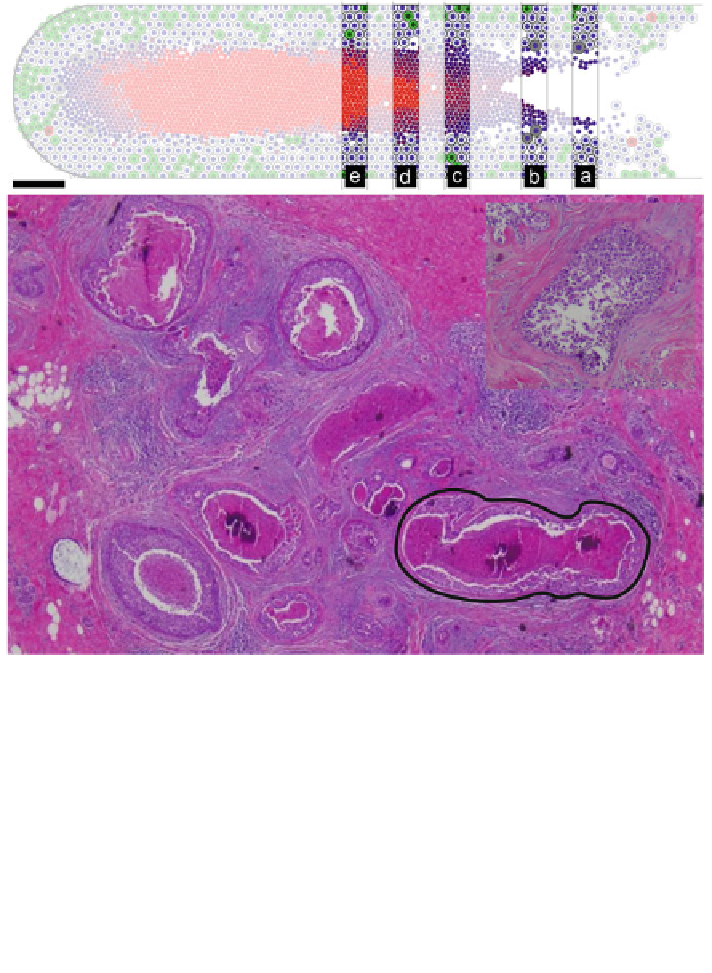
Fig. 11 Top: Patient-calibrated DCIS simulation from Fig.
8
with selected cross-sections
highlighted to emphasize the emergent necrotic core microstructure. Near the leading edge (slice
a), little necrotic debris has accumulated in the lumen. Farther back, relatively intact necrotic
debris forms a ring near the necrotic boundary (slice b). Farther still, the lumen is completely
filled with necrotic debris, with increasing degradation towards the center (slice c). Farther back,
the oldest material is calcified, surrounded by relatively degraded debris (slice d). Calcification
increases with distance from the leading edge (slice e). Reproduced with permission from [
56
].
Bottom: All the predicted necrotic core microstructures are observed in the patient's hematoxylin
and eosin (H&E) pathology. Red arrows show necrotic debris with relatively intact nuclei. Green
arrows show relatively degraded necrotic debris. White vertical arrows show calcification. Black
arrows show the mechanical tear at the perinecrotic boundary. Simulated slice b predicts the
microstructure seen in duct 1. Simulated slice c corresponds to duct 2. Simulated slice d
corresponds to duct 3. Simulated slice 3 corresponds to duct 4. Inset: A duct similar to slice a.
Pathology images adapted with permission from [
56
]
necrosis. If any of these scales were changed or removed, the microstructure
would be altered. Indeed, better accounting for the time scales of nuclear degra-
dation and fluid loss would likely improve the quantitative match to the patient
pathology [
56
,
64
].


Search WWH ::

Custom Search