Biomedical Engineering Reference
In-Depth Information
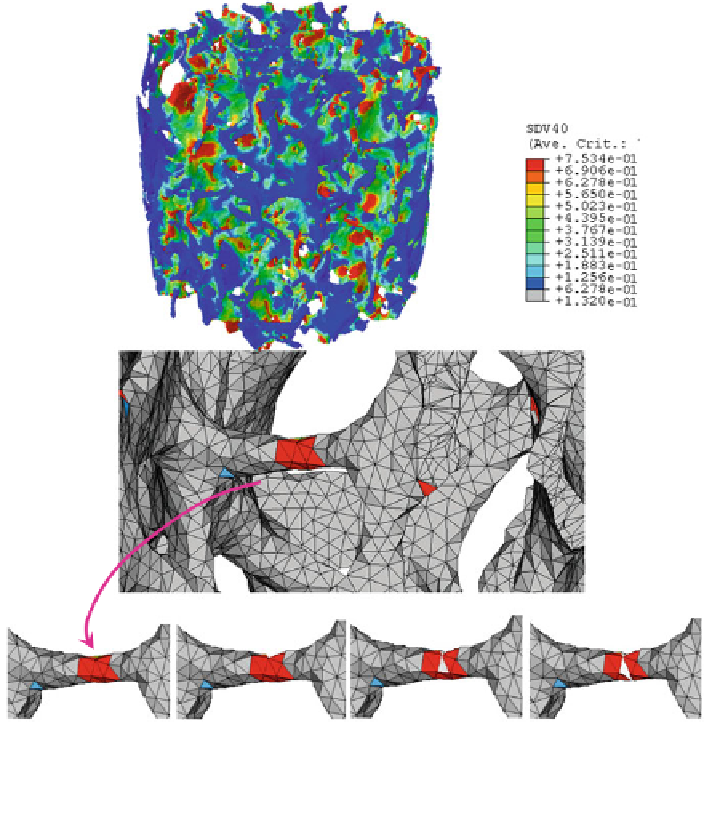
Complete
trabecula
fracture
Fatigue
damage
Crack
propagation
crack initiation
Fig. 10 Contour of fatigue damage within a trabecular bone specimen (cycle = 1.E5,
r
¼
110 MPa, BV
=
TV
¼
26
:
2 %). The enlargement shows the location of a fatigue crack and
its corresponding initiation and propagation process
In Fig.
11
, an enlargement of the predicted fatigue damage contour is given and
compared with reported experimental results. Micro-CT images of trabecular bone
specimens were obtained at 10 lm resolution by Wang et al. [
50
] to measure the
fraction of damaged bone tissue and to capture localized regions of damage in
trabecular bone specimens (Fig.
11
b).
The predicted damage was found to be located in a limited number of tra-
beculae at low apparent stress levels during the first cycle stage. It can be seen that
the predicted damage contour of Fig.
11
a is qualitatively similar to the experi-
mental ones of Wang et al. [
50
]. Both results show that the damage is localized in
small areas of the bone. Such local damage generates local non-linearities. This is
in agreement with experiments by Dendorfer et al. [
9
]. The authors showed that


Search WWH ::

Custom Search