Biomedical Engineering Reference
In-Depth Information
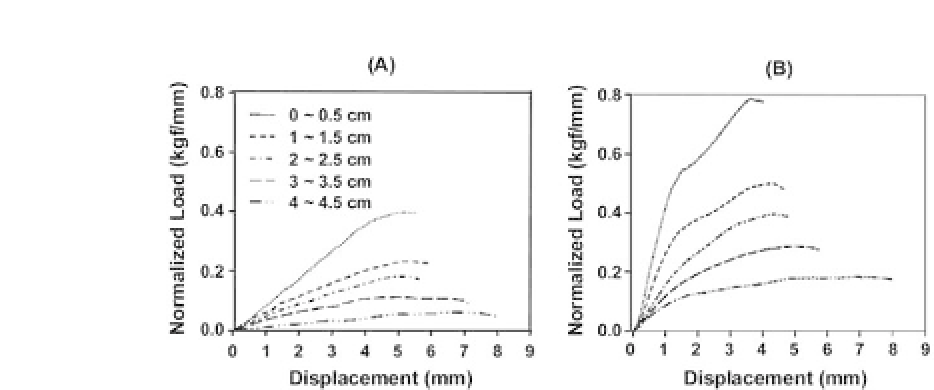
Figure 30.6.
Normalized load displacement curves of cylindrical alginate
scaffold sections along the longitudinal direction. (a) Nontreated and (b)
chitosan-treated scaffold sections (Ref. 22).
specimen placed on a mold-type grip, and the load displacement
curves were obtained. The load values were normalized by divid-
ingwiththethicknessofscaffold(load/scaffoldthickness,kg
f
/mm).
Figure 30.6 compares the mechanical strengths of alginate scaffold
sections with/without chitosan treatment. The mechanical strength
of the scaffold sections along the longitudinal direction gradually
decreased with increasing pore size and porosity, as expected (bot-
tom positions of the cylindrical scaffold have smaller pore sizes
as well as lower porosities, as discussed earlier). The chitosan-
treatedscaffoldsections(Fig.30.6b)showeddramaticallyincreased
mechanical strengths compared with the scaffold sections without
the treatment (Fig. 30.6a).
It seemed that the positively charged chitosan provides the ion
complex with the negatively charged alginate fibrils (i.e., ion com-
plex between -NH
3
+
of chitosan and -COO
-
of alginate), resulting
in the fibril bonding and the increased mechanical strengths. The
chitosan treatment to alginate scaffolds may provide an additional
benefit of improving cell compatibility. The mechanical strengths of
chitosan scaffolds showed a similar trend to the alginate scaffold:
the mechanical strength of the scaffold sections along the longitudi-
nal direction gradually decreased with the increasing pore size and
porosity (Fig. 30.7), but the strengths were lower than the alginate
scaffold sections even though their pore sizes and porosities were
almost the same.


Search WWH ::

Custom Search