Biomedical Engineering Reference
In-Depth Information
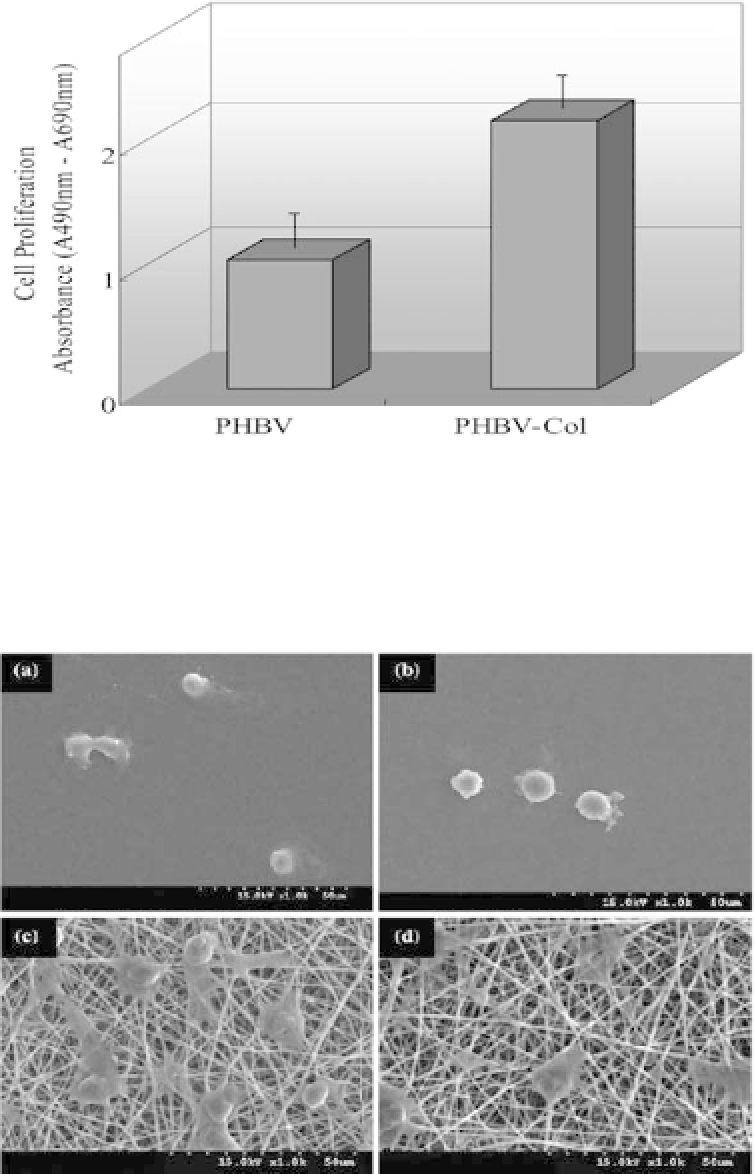
Figure 13.8.
Proliferation of NIH3T3 cells cultured for 68 h. Data is
expressed as mean
±
SD (
n
=
5) for the specific absorbance (adapted from
Ref.16).
Figure 13.9.
Adhesion of fibroblasts on a (a) culture dish, (b) PHBV film,
(c) PHBV, and (d) PHBV/gelatin nanofibrous scaffolds for 4 h incubation
(adapted from Ref. 17).


Search WWH ::

Custom Search