Biomedical Engineering Reference
In-Depth Information
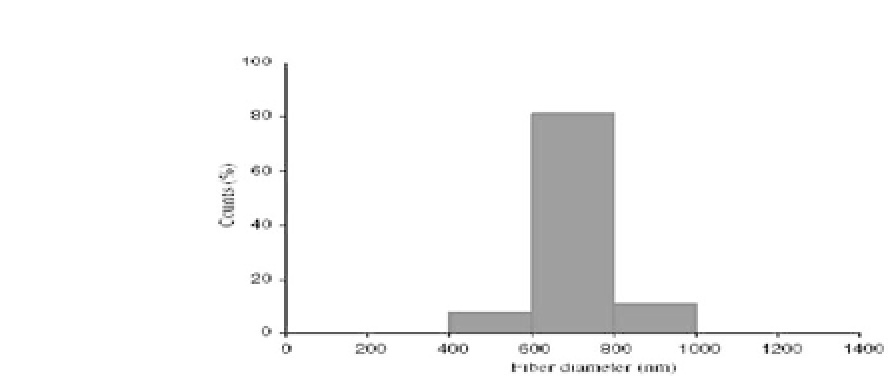
Figure 13.6.
Diameter distribution of PHBV nanofibers electrospun from
a 6 wt%PHBV-TFE solution (adapted from Ref. 17).
concentration of 2-8 wt%, at a 50/50 mixing ratio. At a concentra-
tion of 4 wt% and 6 wt%, respectively, continuous nanofibers with-
out beadscould beobtained.
The image analysis of PHBV/gelatin nanofibers (6 wt%, 50/50)
revealedthattheirdiametersrangedfrom400to1000nm,asshown
in Fig. 13.6.
13.5 Interaction of As-Prepared Nanocomposites with
Cells and Results Obtained Thereby
When as-prepared nanofibrous composites interact with cells,
the nanocomposites show improved biocompatibility. They exhibit
highercelladhesion,proliferation,andviabilitycomparisonwiththe
control nanofibers. Results obtained by the interaction of biomole-
cules containing nanocomposites with cells are discussed briefly in
this section on the basisofselected research studies.
13.5.1
PHBV-Col Nanocomposites
Cell culture experiments indicated that the PHBV-Col nanofibrous
scaffold accelerated the adhesion and growth of NIH3T3 cells more
effectively than the PHBV nanofibrous scaffold, thus making the for-
meragoodcandidatefortissueengineering.
16
Figure13.7showsthe
adhesionofNIH3T3fibroblastsonPHBVandPHBV-Colnanofibrous


Search WWH ::

Custom Search