Geoscience Reference
In-Depth Information
WWA
MMT
WWA
MMT
Positive PDO: Dry
Negative PDO: Wet
IID
La Niña: Wet
El Niño: Dry
OOR
OOR
WWY
IID
WWY
NNV
UUT
NNV
UUT
CCO
Positive PDO: Wet
Negative PDO: Dry
La Niña: Dry
El Niño: Wet
CCO
CCA
CCA
AAZ
NNM
AAZ
NNM
A
B
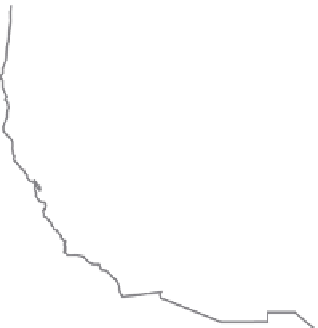
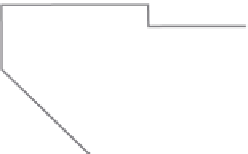
figu r e 12 . Maps of the western United States showing (A) the correlation between
winter (November through April) precipitation and the El Niño-Southern Oscillation, and
(B) the correlation between winter precipitation and the Pacii c Decadal Oscillation. (Maps
courtesy of Dr. James Johnstone at the Joint Institute for the Study of the Atmosphere and
Ocean, University of Washington.)
and l oods during El Niño while the climate in the Pacii c Northwest is
unusually dry (see i gure 12A). h e geographic transition between these two
opposite climate responses ot en occurs in Central California, which can
experience extreme conditions in either direction.
Together, El Niño, La Niña, and the Southern Oscillation are major
players in the ENSO, that ocean/climate phenomenon of interrelated (and
ot en destructive) shit ing pressures, wind-ocean currents, and ocean surface
temperatures. h e Southern Oscillation Index (SOI) is a measure of the dif-
ferences in atmospheric pressure between the western and eastern tropical
Pacii c Ocean (measured in Tahiti and in Darwin, Australia), and it rel ects
the state and strength of the system. When the SOI is negative, air pressure
is below normal in Tahiti and above normal in Darwin (with warmer waters
in the eastern Pacii c)—typical of an El Niño year. During periods of nega-
tive SOI, precipitation is highest in the Southwest and lowest in the Pacii c
Northwest. A positive SOI brings the opposite climate patterns: dry in the
American Southwest, wet in the Pacii c Northwest.
h e link between the ENSO and precipitation in the western United
States arises, in part, from the location of the jet stream, which is a corridor
of fast-l owing air occurring at the boundary between cold air to the north