Biomedical Engineering Reference
In-Depth Information
100%
0.70
0.75
0.80
0.85
0.90
0.95
90%
80%
70%
60%
50%
40%
30%
20%
10%
0%
IND
SIM
AVG
MUL
Best SI*
Atlas Selection Strategy
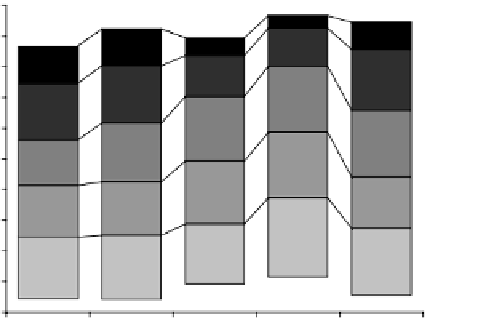
Figure 11.20:
Percentage of registration-based segmentations with similarity
index SI better than the given threshold plotted by atlas selection strategy. The
series labeled “Best SI” is the upper bound of all strategies working with a single
individual atlas (see text for details).
strategy was that different atlases lead to segmentations of different accuracies.
Combined, both observations lead to an even more interesting concept: com-
bination of multiple atlas-based segmentations, weighted by estimates of their
individual segmentation accuracy.
In other words, if we had estimates of how well each atlas-based classifier
is performing, then we could be more confident in decisions of those classifiers
that perform well, compared to the decisions of those that do not. One would
hope that by concentrating on more accurate classifiers in the ensemble, the
classification accuracy would be further improved.
The performance of each atlas-based classifier is obviously not known in
general, due to the lack of a ground truth. However, several methods have been
proposed that can estimate the performance parameters, for example, using
expectation maximization (EM) methods. Two of these are outlined below, one
based on a per-label binary performance model [79], and another based on a
simultaneous multilabel performance model [60, 61].
For the description of both methods, we assume that an image with
N
voxels
is segmented by
K
different (atlas-based) classifiers. For each voxel
x
, we denote
with
e
k
(
x
) the decision by classifier
k
, which is one of the labels assigned in