Biomedical Engineering Reference
In-Depth Information
1000
1.00
900
0.90
800
0.80
700
0.70
600
0.60
500
0.50
400
0.40
300
0.30
200
0.20
100
0.10
0
0.00
Anatomical Structure
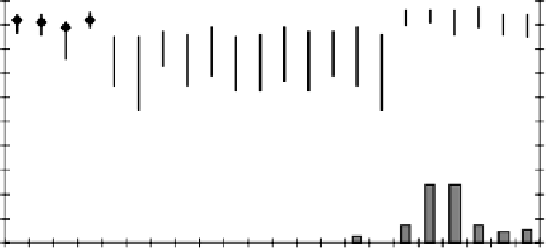
Figure 11.13:
Volumes of anatomical structures and corresponding segmenta-
tion accuracies. The gray bars show the volumes (in numbers of voxels) of the
22 anatomical structures, averaged over the 20 bee brains. The black vertical
lines show the range of SI values achieved by the automatic segmentation (MUL
paradigm) over all segmented raw images. The diamond shows the median over
all segmented raw images.
A surface voxel is easily defined as one that has a neighbor with a label different
from its own. When the entire surface of a structure is misclassified, this can be
seen as an erosion of the structure by one voxel. The SI value computed between
the original structure and the eroded structure represents the SI resulting from a
segmentation that misclassifies exactly all surface voxels. From the structure's
SVR
ρ
and its total volume
V
, this SI can be computed as
2
V
(1
−
ρ
)
V
+
(1
−
ρ
)
V
=
1
−
ρ
1
−
ρ/
2
.
SI
=
(11.11)
Similarly, we can estimate the SI resulting from a misclassification of half of all
surface voxels. Figure 11.14 shows the SVR values computed for all structures
in all brains in our 20 bee brains, plotted versus the SI values of the automatic
segmentations. The figure also shows two curves that represent the theoretical
misclassification of all and half of all surface voxels, respectively.
For a typical segmentation result of a single structure, a detailed compari-
son of manual and automatic segmentation is shown in Fig. 11.15. The structure
shown here, a right ventral mushroom body, is typical in that its volume and