Biomedical Engineering Reference
In-Depth Information
0.09
10000
100
ignored
10000
0.08
1
100
ignored
1
0.07
0.06
0.05
0.04
0.03
0.02
0.01
0
−
15
−
10
−
5
0
5
10
15
X Translation (mm)
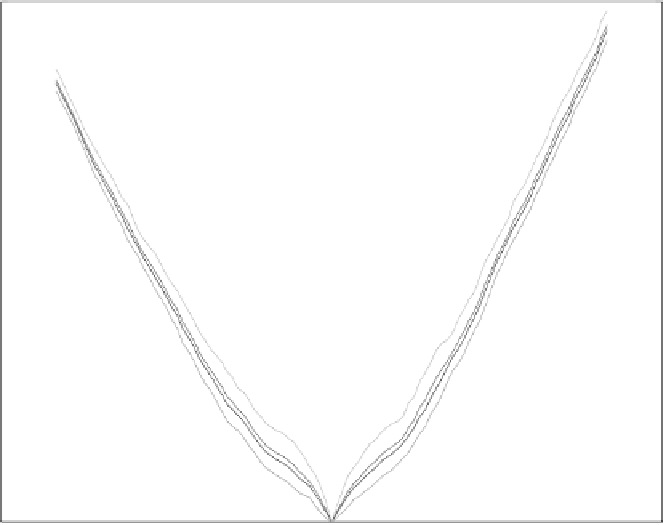
Figure 10.20: The reversed cross-entropy profiles of an MR/Em image pair in
the vicinity of a manual registration when the x-translation changes indepen-
dently. The numbers around the profiles indicate the
α
value used to compute
a small probability value which is used to replace zero pdf. Ignored means that
those pdfs are ignored when computing the profile.
interpolation methods can attribute to the different levels of smoothness of the
similarity measures (see [16]). A smooth similarity function is desirable since
the spurious peaks and valleys can trap the optimization to undesirable local
optima.
Acknowledgements
The image files were provided by Dr. M. Hartshorne. Thanks are also due to
B. Jones, D. Maniawski, Z. Mercer, and C. Nortmann who manually registered
the MR/SPECT image pair used in the similarity minimization study.


