Biomedical Engineering Reference
In-Depth Information
0.2
SD
0.18
0.16
SD
0.14
0.12
CE
0.1
RCE
CE
0.08
RCE
0.06
0.04
0.02
0
−
15
−
10
−
5
0
5
10
15
X Translation (mm)
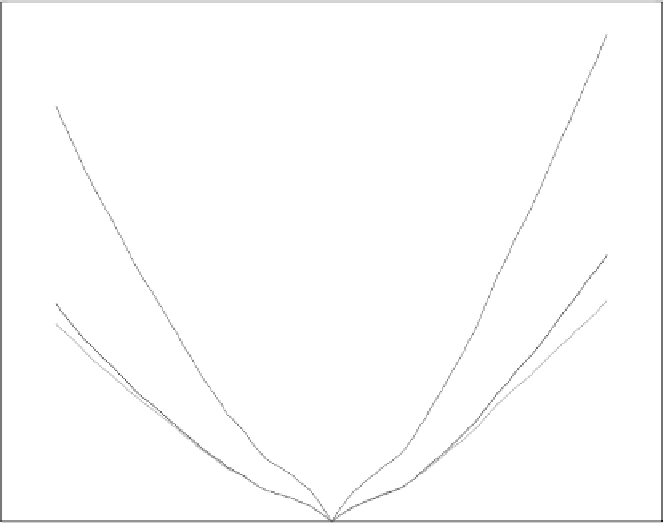
Figure 10.14: The cross-entropy (CE), reversed cross-entropy (RCE), and sym-
metric divergence (SD) profiles (with a likely priori) of an MR/Em image
pair in the vicinity of a manual registration when the x-translation changes
independently.
substituted pdfs in the calculation. The small positive pdfs can be calculated in
the same fashion as discussed in sections 10.3.6 and 10.5.1.4. Figures 10.17 and
10.18 show the cross-entropy profiles as the
x
-rotation angle and
x
-translation
offset change independently. The profiles are labeled in the same manner as for
the reversed cross-entropy maximization case. As those two figures reveal, all of
the profiles have a similar shape. The only apparent difference is the value of the
cross-entropy. Since the size of the basin around the optimal value indicates the
size of the capture range, it seems that either using a small
α
or ignoring the zero
pdf terms is preferred. We elected to ignore the zero pdf terms since the effect
of the small
α
on the summation of all priori pdfs is hard to quantify (the sum
has an upper bound of 1
+
1
α
). This strategy worked fine in our experiment.
In the reversed cross-entropy minimization, the calculation is not stable when
the joint pdfs are zero. Figures 10.19 and 10.20 show the reversed cross-entropy
profiles when the
x
-rotation angle and the
x
-translation change independently


