Biomedical Engineering Reference
In-Depth Information
1.05
1
0.95
0.9
CE
0.85
CE
0.8
SD
RCE
0.75
SD
0.7
RCE
0.65
−
15
−
10
−
5
0
5
10
15
X Rotations (degrees)
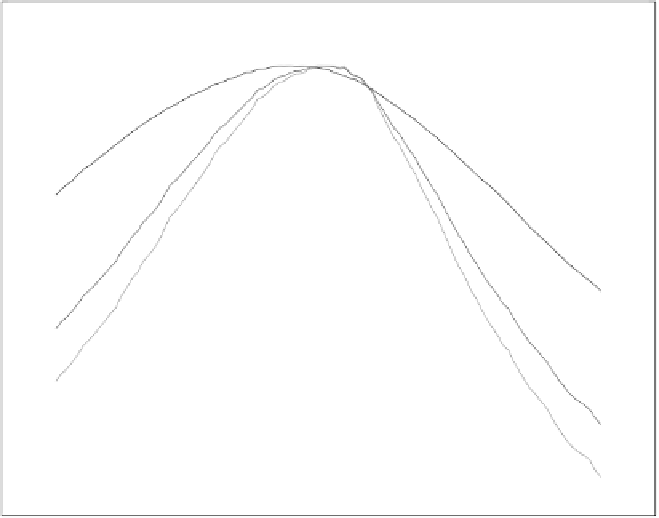
Figure 10.3: The cross-entropy (CE), reversed cross-entropy (RCE), and sym-
metric divergence (SD) profiles of an MR/Em image pair in the vicinity of a
manual registration when the x-rotation angle changes independently.
10.5.1.3
Behavior Around True Registration
Three similarity measures were computed in the vicinity of an optimal registra-
tion. Since the ground truth is unknown, we used the manual registration result
as an approximation to the ground truth. It is difficult to visualize the hyper-
surface in seven-dimensional space. Therefore, only one registration parameter
was changed at a time when a profile was computed.
Figures 10.3-10.5 show the representative profiles of these similarity mea-
sures as a function of rotation angles about the
x
-,
y
-, and
z
-axis, respectively. The
horizontal axis (registration parameters) in all profiles reported in this chapter
was normalized to the manual registration parameters. All similarity values have
been normalized with a maximum value of 1. As can be seen, the cross-entropy,
reversed cross-entropy, and symmetric divergence measures peak around the
manual registration. However, there are differences as large as 3
◦
in the peak