Biomedical Engineering Reference
In-Depth Information
R
R
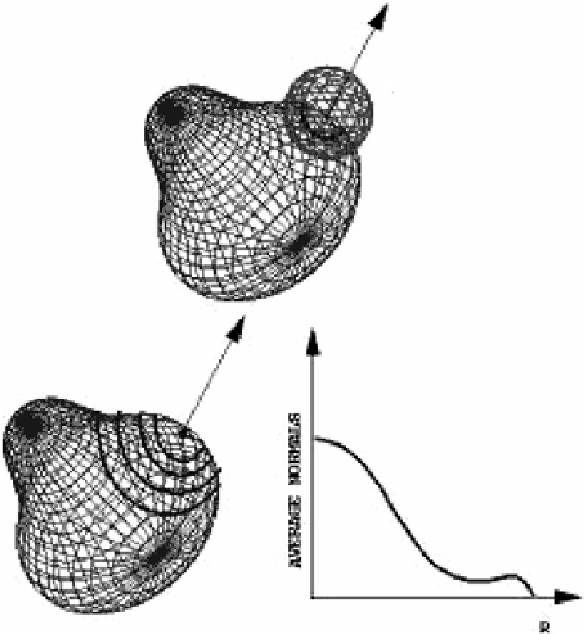
Figure 1.6: An illustration of the “splash” representation scheme. At specific
points on the surface, the intersections of the surface patches and the spheres
of prefixed radii are obtained. For each intersection a curve representing the
average normal of the points in the intersection and the point in study is obtained.
These curves are further used for matching.
around a specific point into a series of contours, each of which is the locus of
all points at a certain distance from the specific point.
Stein and Medioni [27] extended this idea further. Instead of decomposing
a surface patch into a series of contours of different radii, a few contours at
prefixed radii are extracted as shown in Fig. 1.6. On each contour of points,
surface normals are computed. This contour is called a “splash”. A 3D curve is
constructed from the relationship between the splash and the normal at the
center point. This curve is converted into piecewise linear segments. Curvature
angles between these segments and torsion angles between their binormals are
computed. These two features are used to encode the contour.