Biomedical Engineering Reference
In-Depth Information
Population
Displacements
Rotations
∆
y
∆
z
γ
∆
x
α
β
8b
8b
6b
8b
6b
6b
(a)
Displacements
Rotation
∆
x
∆
y
θ
8b
8b
6b
(b)
Figure 1.4:
Different gene structures.
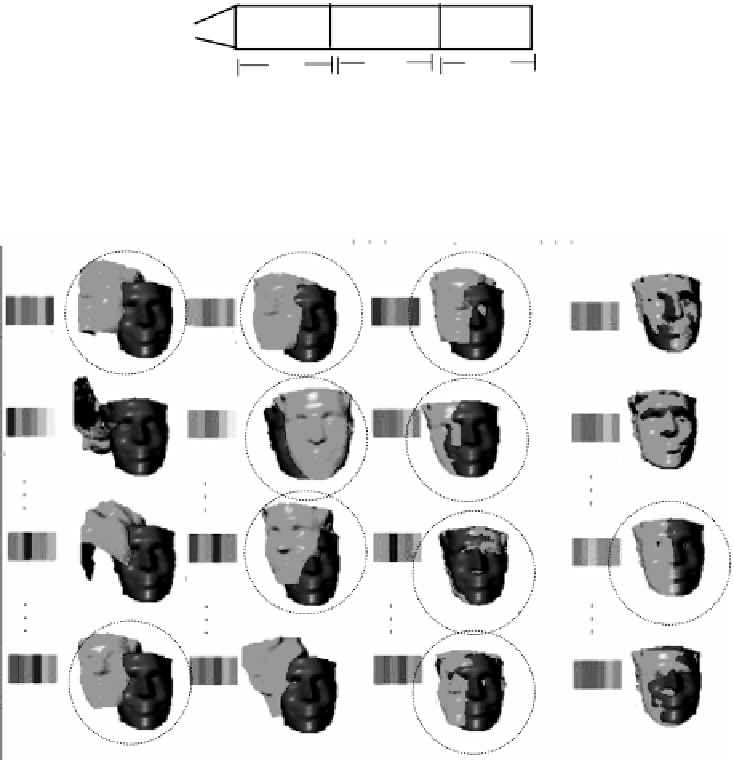
1
5
Generations
2
50
gene 1
gene 1
gene 1
gene 1
fit. 5%
fit. 7%
fit. 25%
fit. 95%
gene 2
gene 2
gene 2
gene 2
.
.
.
.
.
.
.
.
.
fit. 1%
fit. 10%
fit. 60%
fit. 97%
gene 25
gene 25
gene 25
gene 25
.
.
.
.
.
.
.
.
.
.
.
.
fit. 2%
fit. 9%
fit. 98%
fit. 99%
gene 100
gene 100
gene 100
gene 100
fit. 7%
fit. 0.5%
fit. 40%
fit. 95%
Figure 1.5: An illustration of the GA use in calculating the transformation pa-
rameters. The process starts by coding the transformation parameters into one
string. An initial population of strings is randomly generated. Applying the se-
lection, crossover and the mutation operations, new generations are obtained.
Notice how the registration fitness function average increases with the genera-
tions. Maximum fitness can be reached eventually.