Biomedical Engineering Reference
In-Depth Information
Source volume
f
1
ˆ
Reconstructed volume
f
2
(
s
+
w
s
)
Target volume
f
2
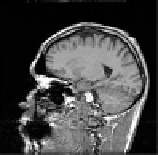
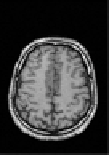
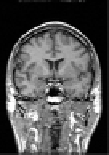
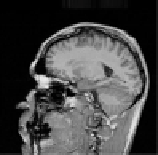
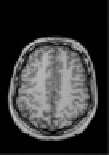
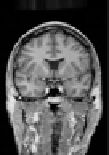
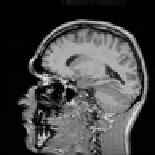
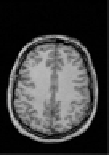
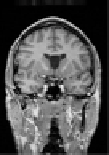
Figure 8.14: Final 3D results of the registration on real data. The volumes
are T1-MRI acquisitions of two different subjects. The reconstructed volume
is computed by trilinear interpolation with the target volume and the final
dense displacement field. In order to evaluate the quality of the registra-
tion, we must therefore compare the source volume and the reconstructed
volume.
In Fig. 8.16, the outliers are drawn, i.e., the data outliers map (variable
δ
s
)
and the spatial outlier map (for each point
s
, we compute the mean of vari-
able
β
sr
with respect to
r
∈
V
(
s
)). Looking at the data outliers map, the dark
points represent areas where the optical flow hypothesis is inadequate, be-
cause of occlusions for instance (see the jaw in Fig. 8.16). For these points,
the regularization term overwhelms the similarity term. Looking at the spa-
tial outlier term, we observe that dark regions are located in the cortex. At
that locations, the importance of the regularization term is reduced, and dis-
continuities can appear. The fact that discontinuities appear in the cortex is
significant because we know that inter-subject variability is very high on the
cortex.